In this time of economic stress across the oil patch, everyone is searching for techniques that can extract increased geological information from seismic data they already have or for methods that provide higher value seismic data across new prospects at the lowest possible cost. Seismic technology developed at the Bureau of Economic Geology provides options that allow these objectives to be realized for several types of land-based reservoir targets.
Embedded images
The key concept that needs to be understood is that two separate independent seismic images are embedded in the responses of vertical geophones. However, only one of these images has been used for decades, this being the compressional (P-P) image. In this wavefield notation, the term P-P refers to data that involve a downgoing illuminating P wave and an upgoing reflected P wave.
The other long-overlooked image that also resides in vertical geophone data is the “SV-P” image. This image is produced by a downgoing illuminating vertical shear (SV) wave that converts to a reflected upgoing P wave at rock interfaces. This is an important point about P-P and SV-P data. Both wavefields involve an upgoing P mode, and P modes are recorded by vertical geophones. Thus, for decades seismic interpreters have used only 50% of the image information that resides in vertical geophone data. In tough economic times it is not wise use of exploration dollars to ignore half of the geological information that is available in P-source vertical-geophone data.
How SV-P data are created
Land-based P-wave sources are one of three types: vertical vibrators, buried explosives or vertical impacts. The seismic community has fallen into the trap of viewing these sources as generating only downgoing illuminating P wavefields. However, well-documented field tests show that all of these P sources generate more downgoing illuminating SV energy than downgoing illuminating P energy. These field test results can be obtained by requests directed to vertishear.com.
An inescapable dual illumination of deep geology occurs when seismic data are generated by traditional P sources. These sources will always illuminate geology with downgoing SV waves in addition to downgoing P waves, and both of these illuminating wavefields will create upgoing P reflections that are recorded by vertical geophones. Thus, SV-P data reside in any data that are generated by a P source and recorded by vertical geophones. These SV-P data can be used to make valuable images that show geological features not seen in P-P images.
Value proposition
The value of SV-P data is that they create an image of geology that is based on SV-to-P reflectivity, not on P-to-P reflectivity. The end result is that rock and fluid properties are revealed with SV-P data that are difficult and often impossible to extract from P-P data. Current industry practice is to create this SV information by acquiring P-SV data, which involves a P source and three-component (3-C) geophones, not vertical geophones. SV-P illumination of geology with vertical-geophone data is the mirror image of P-SV illumination with 3-C geophones. Both imaging options involve the same lengths of SV raypaths; hence, each image provides the same degree of SV sampling of rock properties. Because SV-P and P-SV reflection coefficients are essentially identical, SV-P and P-SV images should be identical if both datasets are properly recorded and processed. Specific examples of the value of SV-P data are:
- Improved fracture analysis of rock units because SV waves are far more sensitive to fractures than P-P data are;
- Improved fault analysis because SV waves detect subtle faults that are not seen with P-P data;
- Imaging Class 2 amplitude vs. offset reservoirs that are invisible on P-P data;
- Imaging through gas-invaded intervals to see geology that is blanked out in P-P images; and
- Access to the velocity ratio, which is the most important of all seismic attributes for mapping lithofacies.
Examples of SV-P images
Extensive searches indicate that only one example of an SV-P image exists in geophysical literature. However, the source used to make that image was a horizontal vibrator, not a P source. Efforts to locate any published example of an SV-P image created by a P source have failed to find a single example. The only examples of SV-P images produced with P sources appear to be those generated at the Bureau of Economic Geology.
The example shown in Figure 1 is a repeat of a graphic that appeared in the November 2016 issue of E&P. The P-P and SV-P images in this figure are depth-registered, and a horizontal line extending across both images is a depth-equivalent horizon. Both images span the Ellenburger carbonate in West Texas. The dashed corridors on the SV-P image enclose reflector sags and terminations associated with karst collapse. Equivalent features are absent or vague in the companion P-P image. This example not only illustrates the diverse nature of the two images that coexist in the same vertical-geophone data, but it also supports the principle that SV-P data are far more sensitive to fractures and subtle faults than are P-P data.

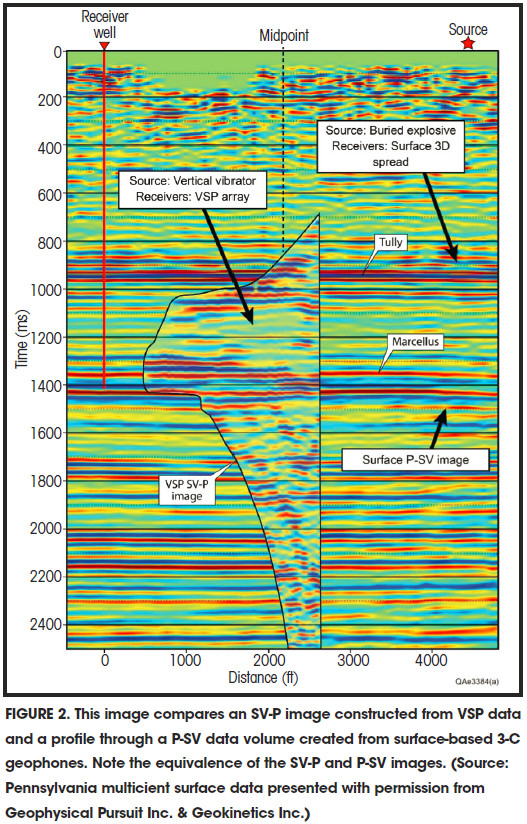
A second SV-P example is displayed in Figure 2. In this case, the SV-P image was made from vertical seismic profile (VSP) data. This image was constructed from the same VSP geophone responses from which the VSP P-P image (not shown) was constructed. Thus the concept that two separate and independent wavefields exist in surface-based vertical geophones also applies to VSP geophones that are oriented to capture upgoing P reflections. The VSP well that provided this SV-P image was inside an area where surface-based 3-C geophones allowed a P-SV image to be made. The agreement between the SV-P and P-SV images verifies the fundamental principle that SV-P and P-SV images are identical when the two wave modes illuminate the same data space.
It is sobering to realize that many thousands of square miles of SV-P data have been recorded and are lying dormant and untouched in libraries as legacy P-wave data. Anyone who has not utilized any type of shear-wave seismic reflection data in prospect evaluation can now do so at minimal cost by using these existing verticalgeophone data. The industry must not continue to ignore 50% of the seismic information that is acquired when seismic data are generated by a P source and recorded with vertical geophones.
Recommended Reading
Shipping Industry Urges UN to Protect Vessels After Iran Seizure
2024-04-19 - Merchant ships and seafarers are increasingly in peril at sea as attacks escalate in the Middle East.
Paisie: Crude Prices Rising Faster Than Expected
2024-04-19 - Supply cuts by OPEC+, tensions in Ukraine and Gaza drive the increases.

Report: Freeport LNG Hits Sixth Day of Dwindling Gas Consumption
2024-04-17 - With Freeport LNG operating at a fraction of its full capacity, natural gas futures have fallen following a short rally the week before.
Permian NatGas Hits 15-month Low as Negative Prices Linger
2024-04-16 - Prices at the Waha Hub in West Texas closed at negative $2.99/MMBtu on April 15, its lowest since December 2022.
BP Starts Oil Production at New Offshore Platform in Azerbaijan
2024-04-16 - Azeri Central East offshore platform is the seventh oil platform installed in the Azeri-Chirag-Gunashli field in the Caspian Sea.