
Source: Reveal Energy Services
[Editor's note: This story first appeared in the 2020 Hydraulic Fracturing Techbook. View the full supplement here.]
As the oil and gas industry works to improve recoverable hydrocarbons, many innovations and advances are shared at conferences and others are shared among colleagues at operator companies. Sharing information, experiences and data ring true at the industry’s core with updated knowledge and lessons learned. With this camaraderie, there is also friendly competition to strive to be the best. These conflicting virtues continually improve the industry through technological advances and new analytics practices. Some of these new practices include adding pressure-based monitoring to the traditional production analysis.
Production analysis has been regarded as the gold standard of comparison. While production is where revenue is accrued, many other diagnostics have recently become economically viable to help explain differences in stimulation effectiveness. Diagnostics must be cost-effective to render the return on invest ment (ROI) that operators seek in the drive to create more value from oil well completions.
Pressure monitoring has emerged as the most cost-effective diagnostic application because of the low cost of devices, minimal operational impacts and vast ability to analyze the data created. For the purposes of understanding more about this technology, Reveal Energy Services combined pressure-based fracture maps (PBFMs) and post-stimulation leak-off analysis to identify reservoir stimulation effectiveness for a full-field pressure monitoring application. Additionally, this method evaluated stimulation at each stage rather than having coarse aggregations at the well level, such as production analysis.
The two diagnostic methods were implemented on multiple pads across the Delaware Basin. These independent diagnostic applications monitored different areas of the reservoir and, when combined, provide a full-field evaluation of each monitored treatment stage. This article reviews the combination of the two methods with the treatment design variables to understand the completion trends that have resulted in optimal rock stimulation.
Pressure monitoring study
The two independent pressure monitoring techniques enabled the full-field stimulation evaluation. This study leverages datasets from multiple operators in a cooperative way. The operators agreed to aggregate and anonymize the data so there is an appropriate distribution to ensure valid conclusions.
The study was based in the Wolfcamp A Formation in the Delaware Basin. Stage-level data that typically include many more datapoints than well level data were considered. Several environmental factors must be similar for comparisons. Using data from similar geographical and geological perspectives helped to keep these environmental factors as close as possible.
The study proceeded as follows:
- First, an independent analysis was conducted for each pressure monitoring method.
- Second, a relative score was given for each method as low (1), mid (2) and high (3).
- Third, a proxy stimulated rock volume (SRV) was calculated by multiplying the scores from both methods.
- Finally, the average completion parameters were calculated (per foot of stage length) and compared to identify relevant distinctive trends.
Method 1 applied PBFMs, a Reveal Energy Services application in which a digital twin model renders the hydraulic extent for a dominant fracture in a given stage to determine fracture height, half-length and azimuth (Figure 1a). The pressure is monitored from an isolated stage in a nearby child, or infill, well. The location of the monitoring stage and treatment stages are inputs into the digital twin model, and the iterative solver updates the geometries so the modeled pressure response matches the observed pressure response. This is a far-field monitoring application because the stress extends through the reservoir to the monitor.
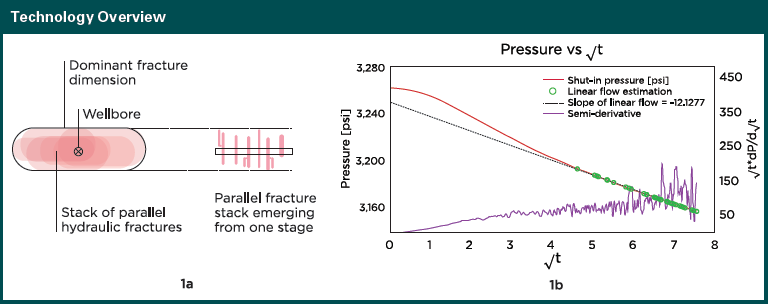
Method 2 applied post-stimulation leak-off analysis, which utilizes the pressure gauge on the treatment well to monitor the pressure decline after the pumps have been stopped for a period up to 1 hour. The rate of pressure decline is proportional to the amount of reservoir contact achieved during stimulation and, therefore, can be used in a stage to-stage comparison (Figure 1b). This monitoring is a near-field measurement because the pressure decline is directly measured from the treatment stage. The combination of the far-field and near-field monitoring provides a full-field evaluation for each completion stage. The full-field method improves the estimation of the SRV for a given stage.

Area is from the PBFM of the dominant fracture, the Length is the stage length and the efficiency factor is derived from the leak-off analysis. The SRV for a well is the summation of each stage’s individual SRV contribution. A proxy to the SRV is used by multiplying the score from the post-stimulation leak-off analysis and the PBFM relative size with Area, and each stage is evaluated individually.
Observations and insights
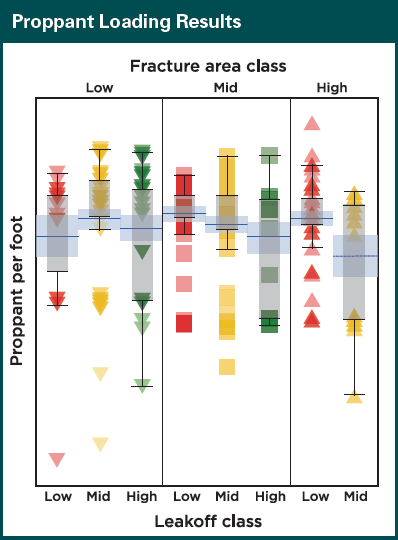
This study arrived at three main insights. The stages with better SRV scores had lower proppant loading (pounds per foot) for a given fracture area. For example, of all the stages with a mid (2) rating for fracture area in the PBFM calculation, the highest SRV group had the lowest proppant loading, and the lowest SRV group had the highest proppant loading (Figure 2).
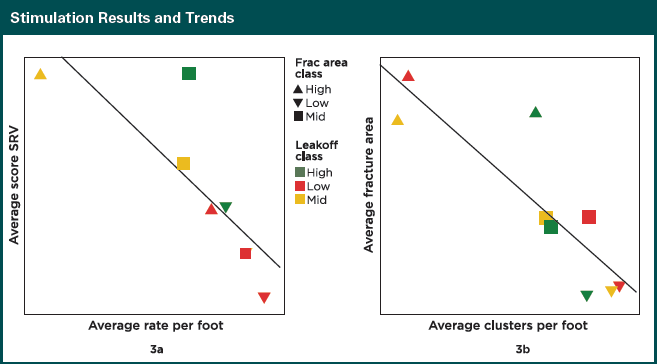
The average pump rate per lateral foot was inversely correlated with the SRV calculation (Figure 3b). The highest SRV calculations had the lowest rate per foot. This study did not evaluate any form of limited entry so these findings are not applicable for those design studies. These findings are not applicable for any form of limited entry, which was not evaluated in this study.
Conclusion
With the combined analysis using PBFMs and post-stimulation leak-off analysis, the operators participating in this study learned that adding more clusters to a given stage while limiting the rate and proppant loading resulted in better SRV. Less proppant may provide enough conductivity for fracture flow, permitting the proppant to be carried farther into the fractures. The cluster density finding confirms that the higher number of perforations per foot can result in better fluid distribution as seen by the smaller dominant fracture area. These optimal rock stimulation trends, as identified in the study, reduced completion costs to improve ROI.
Editor’s note: This article is written from the URTeC- 2020-2677-MS paper, “Combining Pressure-based Fracture Maps and Post-stimulation Leak-off Analysis Lead to Informed Unconventional Development.” It has been reprinted here with permission of URTeC.
Recommended Reading

SilverBow Rejects Kimmeridge’s Latest Offer, ‘Sets the Record Straight’
2024-03-28 - In a letter to SilverBow shareholders, the E&P said Kimmeridge’s offer “substantially undervalues SilverBow” and that Kimmeridge’s own South Texas gas asset values are “overstated.”

Kimmeridge Fast Forwards on SilverBow with Takeover Bid
2024-03-13 - Investment firm Kimmeridge Energy Management, which first asked for additional SilverBow Resources board seats, has followed up with a buyout offer. A deal would make a nearly 1 Bcfe/d Eagle Ford pureplay.

Greenbacker Names New CFO, Adds Heads of Infrastructure, Capital Markets
2024-02-02 - Christopher Smith will serve as Greenbacker’s new CFO, and the power and renewable energy asset manager also added positions to head its infrastructure and capital markets efforts.

TPG Adds Lebovitz as Head of Infrastructure for Climate Investing Platform
2024-02-07 - TPG Rise Climate was launched in 2021 to make investments across asset classes in climate solutions globally.

Stockholder Groups to Sell 48.5MM of Permian Resources’ Stock
2024-03-06 - A number of private equity firms will sell about 48.5 million shares of Permian Resources Corp.’s Class A common stock valued at about $764 million.