
(Source: TGT; Shutterstock.com)
[Editor's note: A version of this story appears in the May 2020 edition of E&P. Subscribe to the magazine here.]
The last few decades have brought impressive advances in production logging technology, especially in the context of new sensor designs and diagnosing complex flow downhole. Fiber optics also are playing an increasing role in production surveillance. However, the fundamental technique of using wellbore-confined production logging tools (PLTs) to infer total well and reservoir flow performance still dominates the industry.
Basically, PLT measurements are used to monitor fluid properties and flow dynamics in the wellbore and, more importantly, to determine production and injection flow profiles where fluids enter or exit the wellbore, such as via perforations or inflow control devices. These measured and calculated flow profiles are used to assess the production and injection performance of the entire well system.
However, the validity and accuracy of the approach depend on many factors, and chief among them is the integrity of communication between the wellbore and reservoir formations at the entry/exit points. Analysts and operators using PLTs must assume that fluids entering or exiting the wellbore are flowing radially from or to the formations directly behind the entry/exit points. Unfortunately, this is often not the case. Flow paths can exist through annular cement channels, formation packers or natural fissures, and fluid will always find the path of least resistance. From a compliance, environmental and performance perspective, these unwanted flow paths are bad news. Decisions made assuming wellbore flow correlating directly to target reservoir flow can lead to complex reservoir and field management issues as well as compromised asset performance. From a diagnostics perspective, it is clear that analysts and operators cannot rely on PLTs alone to diagnose and manage well system performance—a more powerful diagnostic approach is needed.
Seeing further
The challenge of behind-casing crossflow is not new, and the industry has made several attempts over the decades to diagnose this insidious phenomenon. Some of the early techniques used nuclear activation, chemical tracers and noise logging to try to detect and map flow behind pipe, but these methods generally lacked the precision demanded of modern-day diagnostics and were, at best, qualitative.
Operators have increasingly been focused on compliance, the need for better asset performance and pure ingenuity. As a result, a new diagnostic capability has emerged for diagnosing flow downhole.
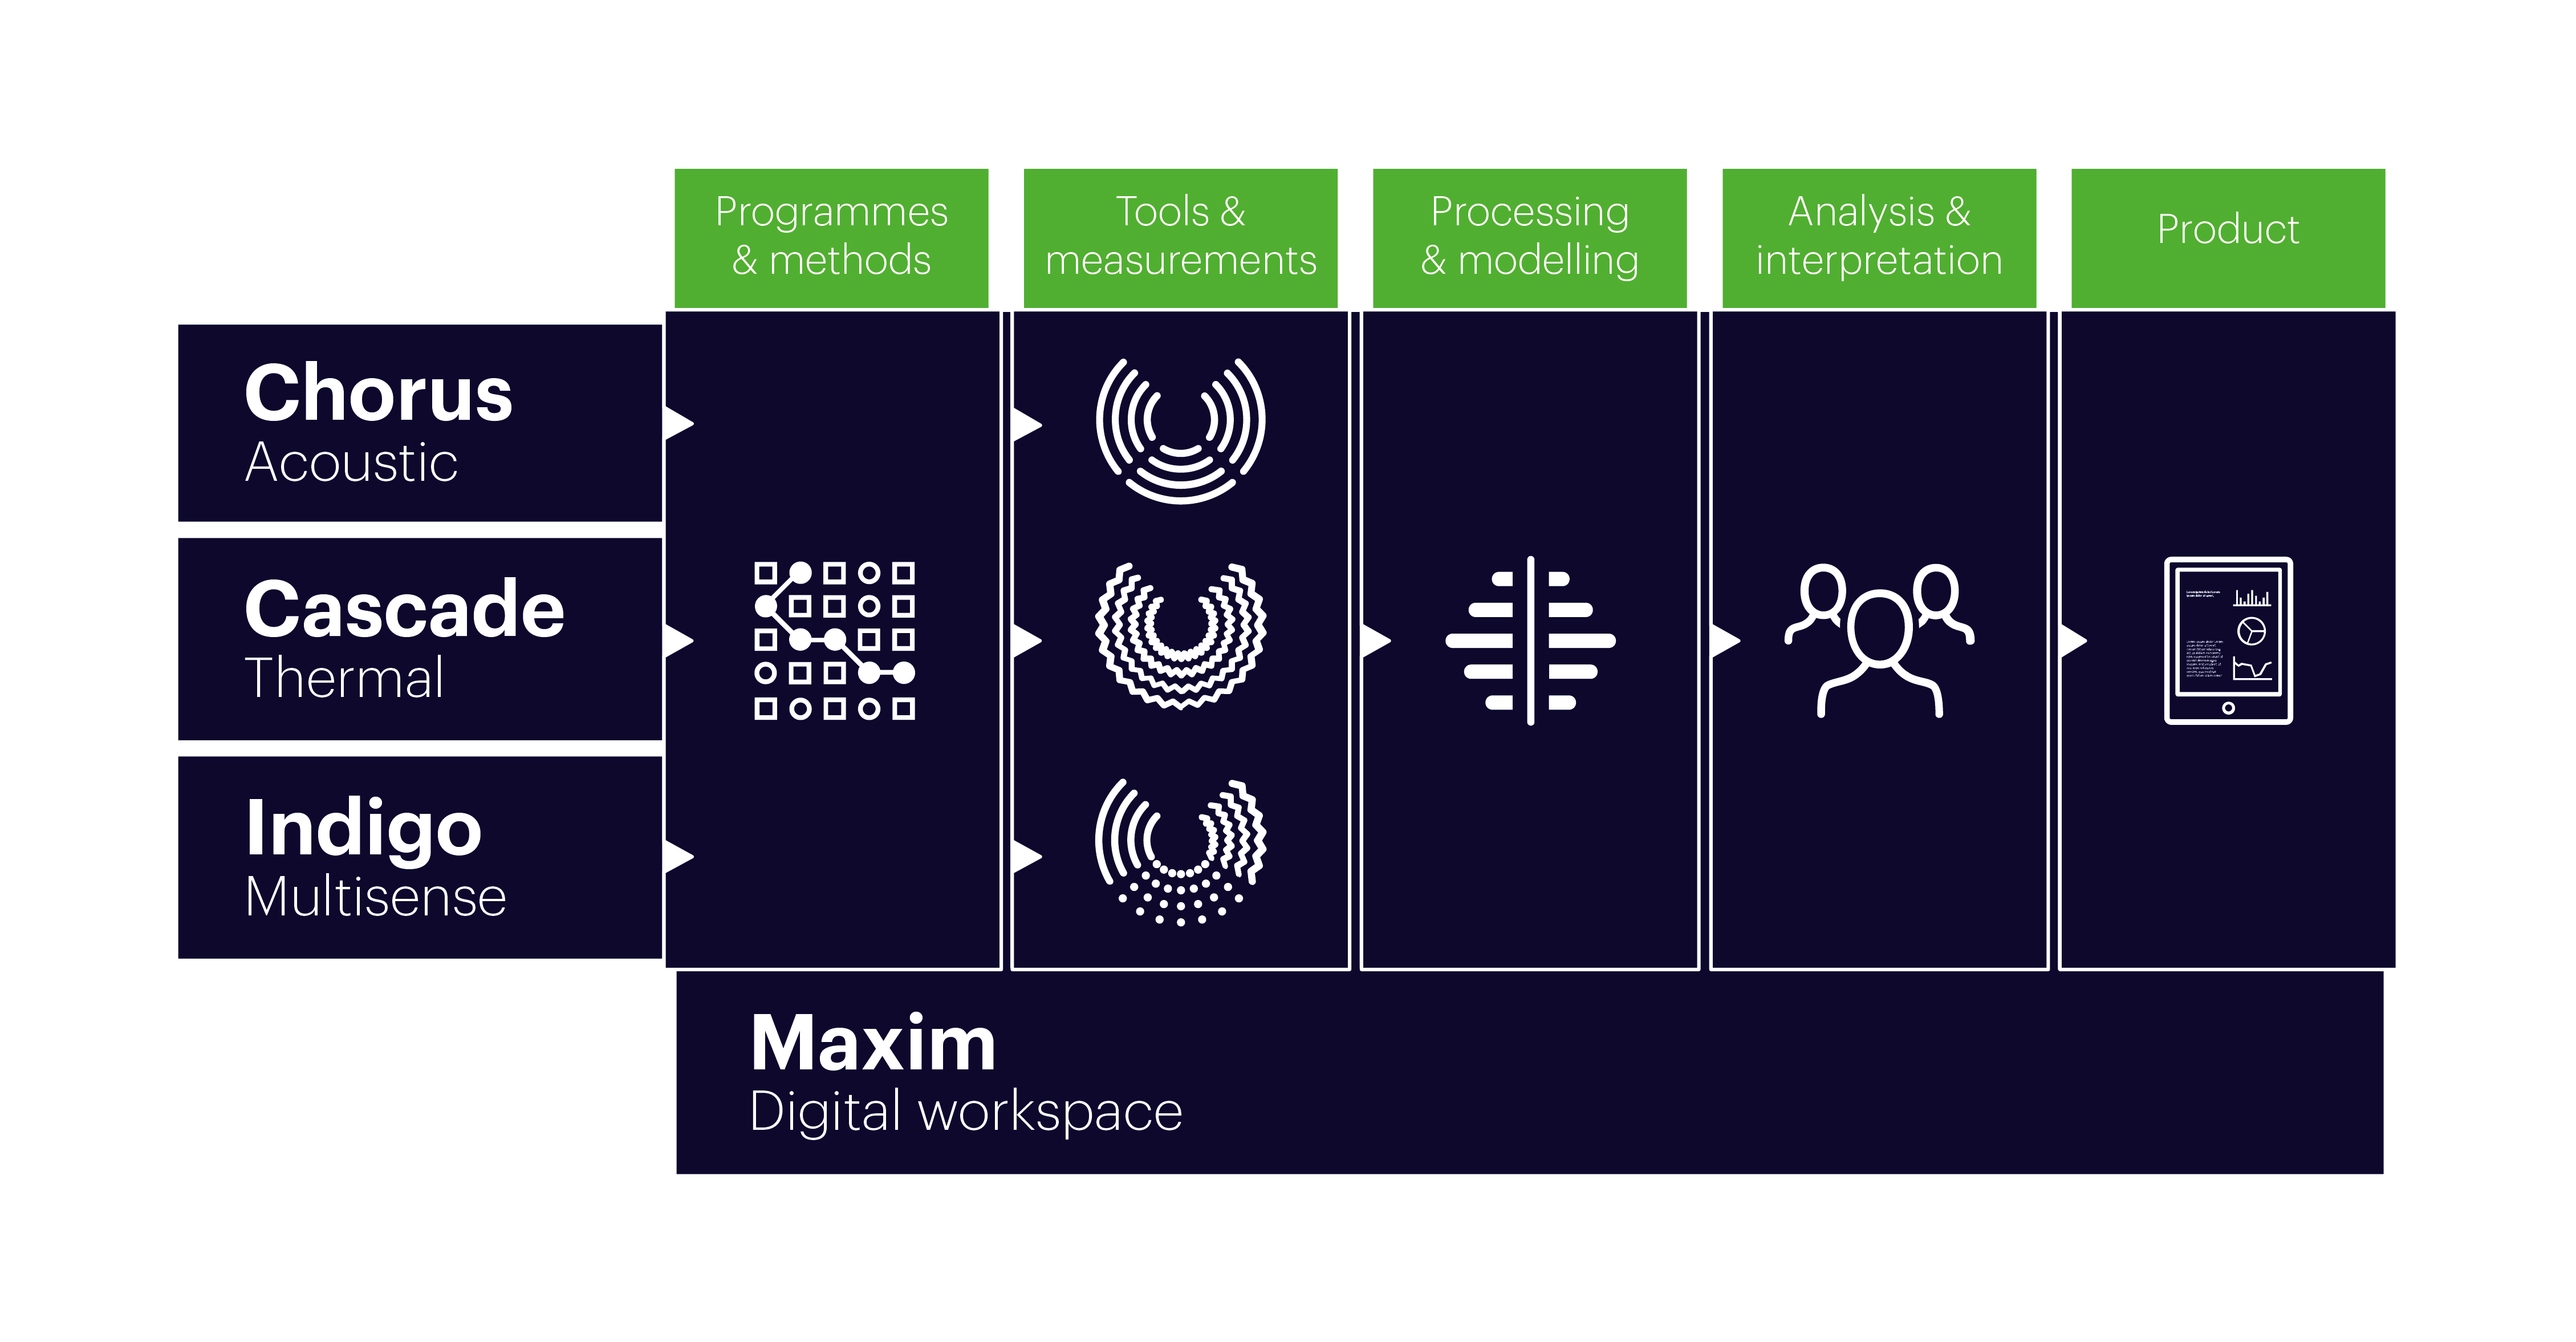
Understanding the dynamics and connectivity of wellbore and reservoir flow downhole with any degree of precision and accuracy is a highly complex task that extends beyond the capabilities of conventional logging. This is why True Flow diagnostics utilizes a more powerful system-based approach. The system delivers a complete picture of well system flow dynamics and enables better-informed well, reservoir and field management decisions (Figure 1).
Programs and methods
The first stage in the workflow is programs and methods. Following an initial customer consultation, an analysis of well performance history, completion design and reservoir and fluid properties, and an assessment of diagnostic objectives, analysts customize a survey program that will effectively “stress-test” the well system to expose its flow dynamics in a number of scenarios. This can be likened to a heart specialist exercising a patient on different treadmill settings while scanning physiological parameters such as heart rate, blood pressure and electrocardio signals. Typical programs will include a precisely timed sequence of flowing and non-flowing surveys that allow the entire well system to warm up and cool down between surveys.
Tools and measurements
The second stage is the application of high-fidelity tools and measurements by engineers that survey the well according to the diagnostic program. The measurements come from basic and advanced PLT-type wellbore probes and a combination of acoustic and high-precision temperature sensors. Fluids flowing throughout the well system generate acoustic signals encoded with flow information. The acoustic sensing technology used by the True Flow system captures this information in the form of sound pressure across a wide frequency and amplitude range.
Importantly, the dynamic range of this technology means it can sample absolute sound levels from deafeningly loud to imperceptibly quiet without losing clarity or detail. This means that a wide variety of flow scenarios can be located and characterized throughout the well system, from the wellbore to several meters into the reservoir formation. The temperature sensor in itself is unremarkable, being an industry standard fast-response, high-precision type capable of resolving to decimals of degrees. However, correlating temperature changes observed during the diagnostic program and combining it with the acoustic data, wellbore flow measurements and other well and reservoir information is the key to quantifying flow by the next ingredient of the system—processing and modeling.
Processing and modeling
During the processing and modeling stage, data acquired during the survey program are enhanced further by analysts using a digital workspace and a number of processing and modeling plug-ins. High-resolution acoustic data are transformed into an “acoustic power spectrum” to reveal the characteristic signatures of different types of flow. Analysts can select from a catalog of digitally enhanced spectra to illuminate particular aspects of the flow and extract maximum information from the acoustic signals.
The subsequent flow modeling is integral to the entire system and represents another significant advancement in flow diagnostics. Precision temperature measurements acquired during all stages of the diagnostic program are assimilated together with all other data to derive reservoir flow profiles. These are distinct from conventional PLT-derived wellbore flow profiles because they quantify flow exiting or entering formation layers whether or not casing or perforations are present. Built on more than a decade of research and experimentation and commercially proven in thousands of wells, the flow modeling engine solves complex thermo-hydrodynamic physics by matching simulated and measured temperature and other responses in the flow scenarios created during the diagnostic program. The result is quantified reservoir flow that, together with wellbore flow measurements, completes the total flow picture.
Analysis and interpretation
The previous True Flow stages are curated under the watchful eye of analysts that also administer the final important stage of the workflow—analysis and interpretation. Armed with all available well data, processed and modeled results, and expert knowledge of true flow applications, the analyst will derive and compile the diagnostic result. While more complex scenarios can take a number of days to complete, the final result is a more comprehensive and accurate diagnostic of reservoir and wellbore flow that ultimately leads to better well management decisions and improved asset performance.
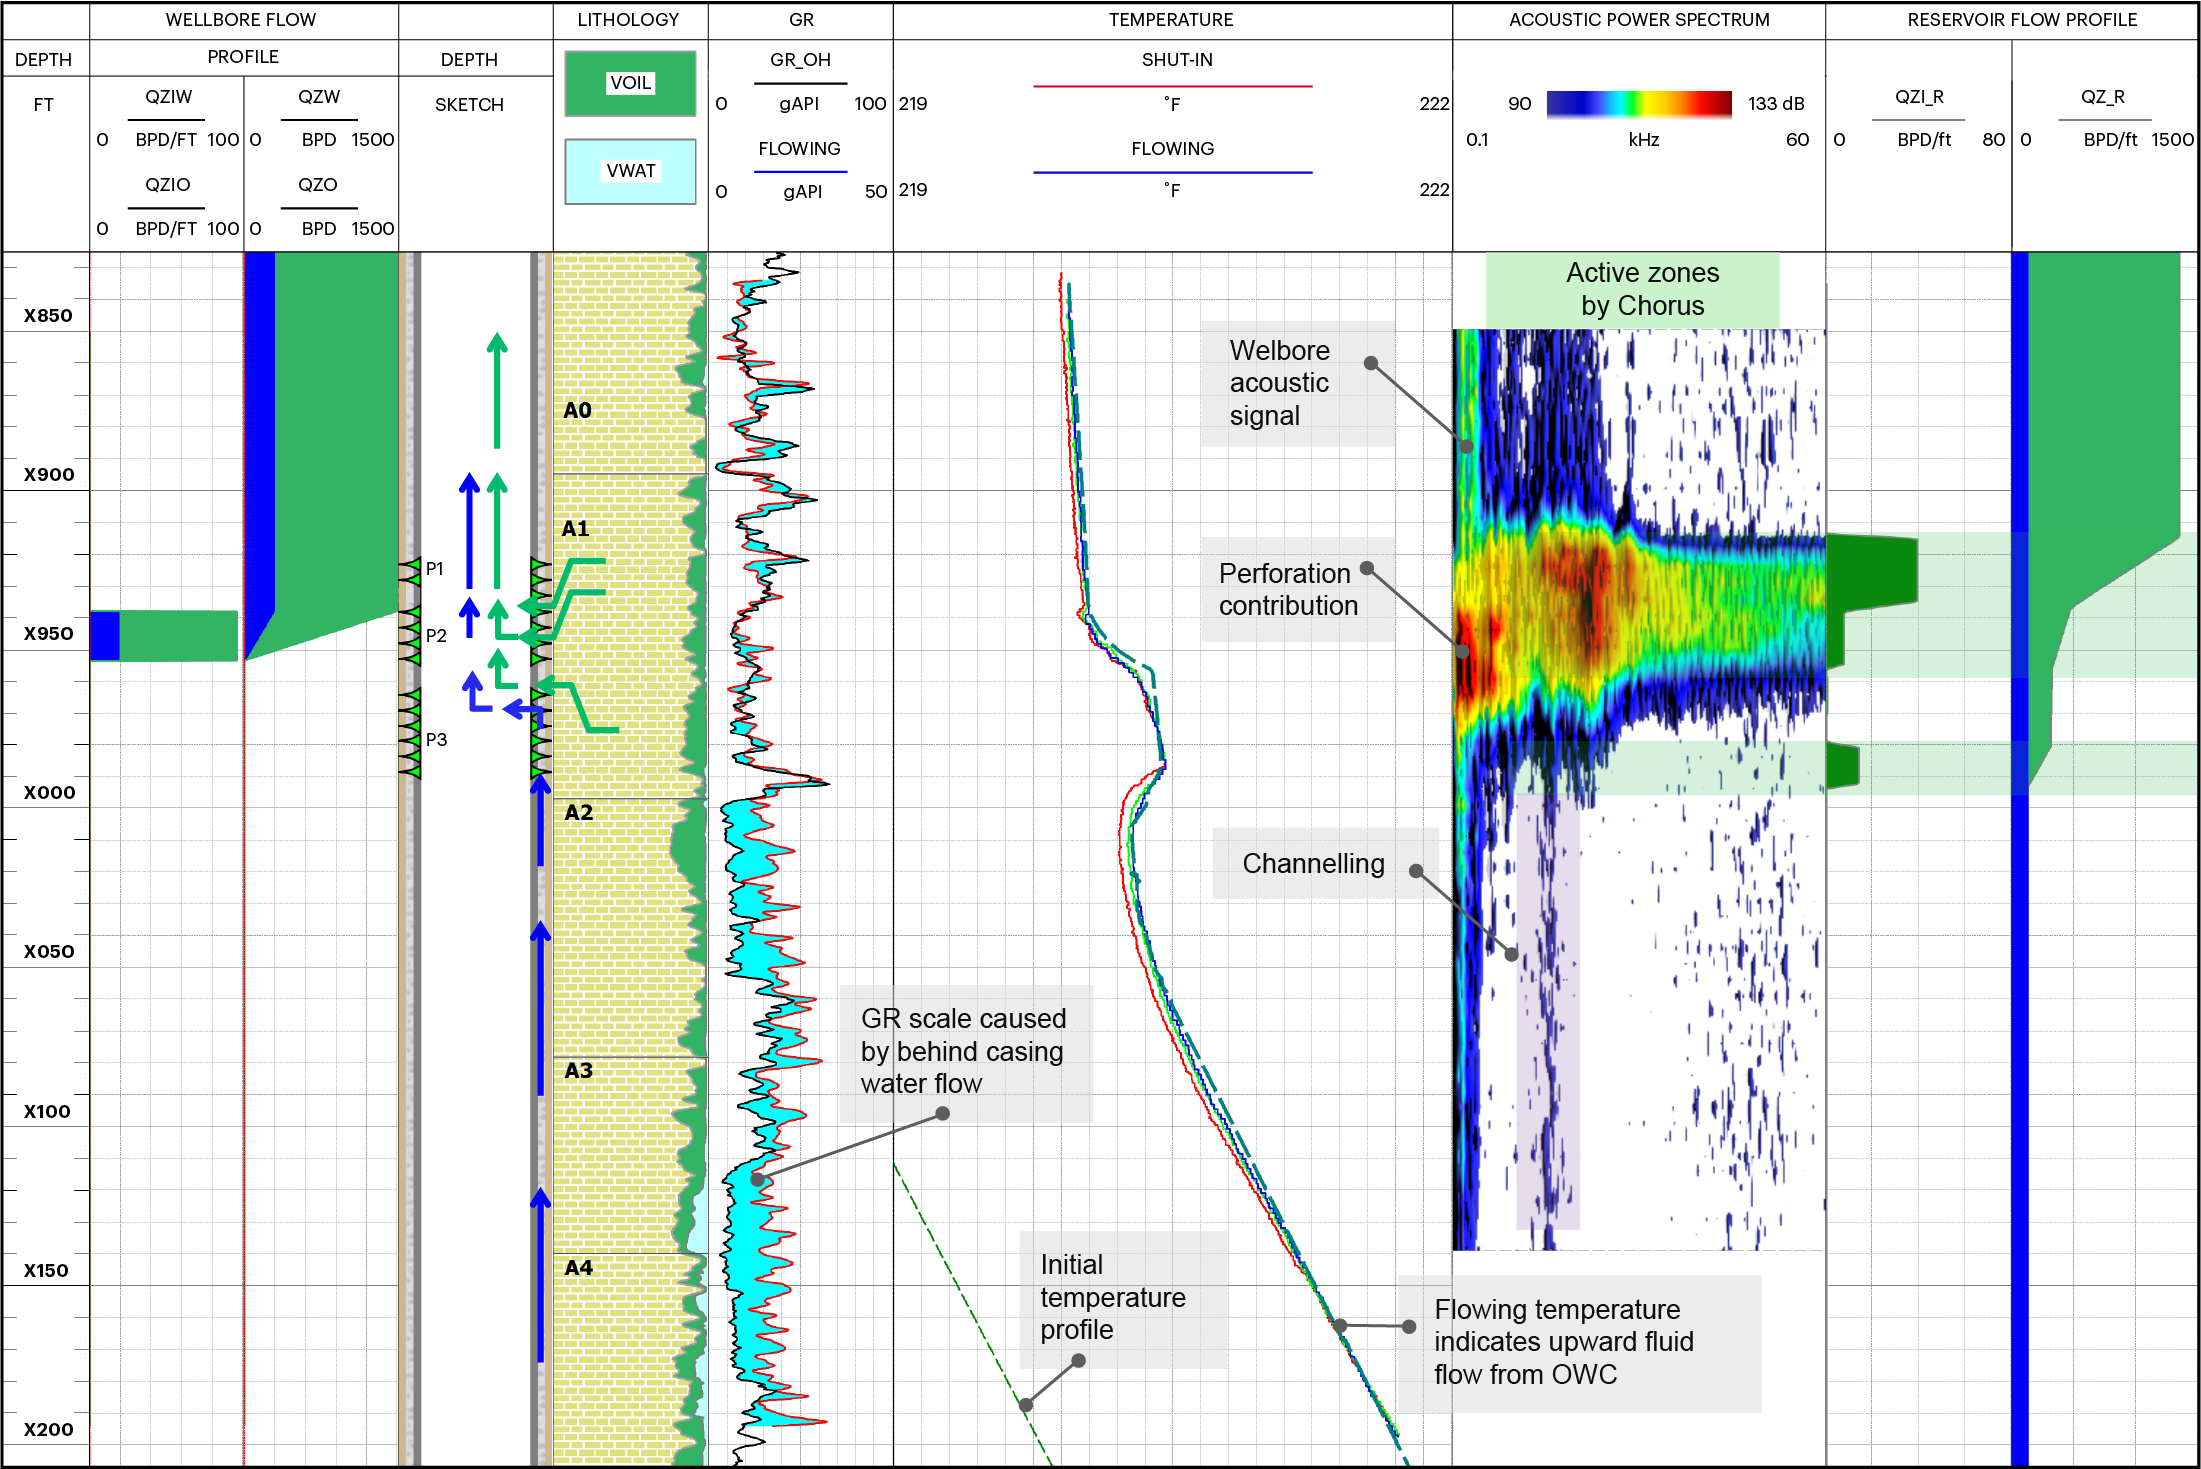
The system is used to provide a range of diagnostic answer products that address most flow-related applications. These products include Total Flow, which combines both wellbore and reservoir flow (Figure 2), Sand Flow for sand management applications, Fracture Flow to optimize fracturing programs, Stimulate Flow, Horizontal Flow and many more.
A bright future
The old thinking cannot answer today’s new challenges. As well systems become more complex and older, managing performance will remain a priority and continue to task the industry. Wells are built to connect the right fluids to the right places, safely and productively, but forces, materials and age conspire to undermine this perfect balance. Traditional production logging will continue to play an important role in managing production, but it is clear that the industry needs to look beyond the wellbore to the reservoir itself to see the true picture.
Recommended Reading

US Interior Department Releases Offshore Wind Lease Schedule
2024-04-24 - The U.S. Interior Department’s schedule includes up to a dozen lease sales through 2028 for offshore wind, compared to three for oil and gas lease sales through 2029.

Utah’s Ute Tribe Demands FTC Allow XCL-Altamont Deal
2024-04-24 - More than 90% of the Utah Ute tribe’s income is from energy development on its 4.5-million-acre reservation and the tribe says XCL Resources’ bid to buy Altamont Energy shouldn’t be blocked.

Mexico Presidential Hopeful Sheinbaum Emphasizes Energy Sovereignty
2024-04-24 - Claudia Sheinbaum, vying to becoming Mexico’s next president this summer, says she isn’t in favor of an absolute privatization of the energy sector but she isn’t against private investments either.

Venture Global Gets FERC Nod to Process Gas for LNG
2024-04-23 - Venture Global’s massive export terminal will change natural gas flows across the Gulf of Mexico but its Plaquemines LNG export terminal may still be years away from delivering LNG to long-term customers.
US EPA Expected to Drop Hydrogen from Power Plant Rule, Sources Say
2024-04-22 - The move reflects skepticism within the U.S. government that the technology will develop quickly enough to become a significant tool to decarbonize the electricity industry.