
The buzz these days seems to be that “water is the new oil.” (Source: bmf-foto.de/Shutterstock.com)
The Permian Basin’s prolific rise in world energy dominance in the three short years following the downturn is an awesome testimony to the oil and gas industry’s can-do spirit. The industry is collectively setting its sights on the next round of fine-tuning to ensure the Permian’s massive energy economy can continue operating for the long haul.
The buzz these days seems to be that “water is the new oil.” Of course, water is not trading anywhere close to the value of oil. However, the cost of water and the cost of getting rid of produced water can have a double digit impact on the cost of producing oil. This article examines current market drivers as applied to one of the most prolific operating regions and explores the cost implications for industry and evolving market opportunities for thrill-seeking entrepreneurs and financiers.
Current business drivers
Between 2007 and 2012, produced water volumes across the U.S. were flat, with very little aggregate change over the five years. Historically, produced water from declining conventional formations essentially balanced out the produced water growth from unconventional wells. Sometime between 2016 and 2019, the balance changed in many regions, with unconventional produced water growth overtaking conventional produced water declines, particularly in the Permian.
If the Texas Delaware Basin continues growing 10% or more in annual completions, its produced volumes could rise from an estimated 1.9 Bbbl in 2019 to 4.8 Bbbl in 2024. By comparison, these projected 2024 levels would come close to 25% of the total U.S. produced water volumes just seven years ago, which hovered around 21 Bbbl, according to studies conducted by John Veil for the Groudwater Protection Council in 2012 (Figure 1).
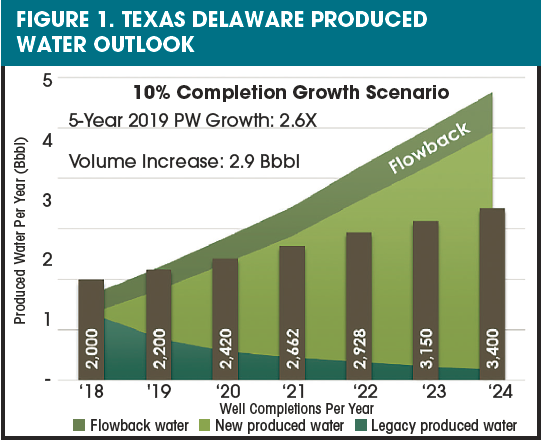
In the Delaware Basin, proppant and frac fluid growth per stage grew 400% from 2013 to 2017, according to Drillinginfo. With four times the volume and 10% to 70% of injected frac fluid flowing back into the production stream in the first year, this added as much as 15% to 20% more volume to the growing base of produced water in the region.
Over the last five years, Texas, Oklahoma, New Mexico and many other oil and gas states have changed either their regulations or internal policies in an attempt to understand and mitigate induced seismicity possibly related to oilfield operations.
In some cases, seismicity was associated with oilfield operations, as with injection into the deep Arbuckle Formation in Oklahoma. When deep injection volumes were reduced, the seismicity subsequently declined. In the Texas Delaware Basin, findings of possible causation have yet to be published within the scientific community (although promising studies are underway). The lack of causation diagnosis creates challenges for regulators and the industry, as each deal with persistent, low-magnitude seismicity may or may not be tied to injection, production or completion activities.
Regulators are taking a conservative stance concerning permitting new injection wells in seismic-prone areas. For example, the Texas Railroad Commission considers new permit applications for disposal wells in seismic areas with greater scrutiny, assigning maximum injection volumes and pressures on a case-by-case basis. Review of permit backlogs, volumes and allowable injection pressures suggests additional disposal well capacity growth will be moderated in these areas with periodic seismicity. Reeves County, in the heart of the Texas Delaware Basin, is one such area. These new internal guidance policies are not anticipated to affect existing saltwater disposal (SWD) wells, although they effectively moderate new (incremental) SWD capacity growth. Importantly, EnergyMakers’ estimate of moderate SWD well growth still reflects a threefold injection increase between 2017 and 2022 (Figure 2).
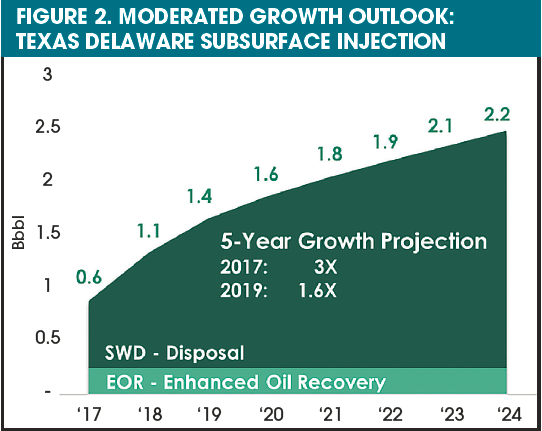
That is a lot of water and a significant increase. EnergyMakers did not account for the theoretical practical limit it modeled, but it assumed behaviors are driven by a combination of regulatory moderation and operator understanding of local formation injectivity.
Similar to episodic regional seismic issues, regions with higher or gradually increasing bottomhole pressures are being observed. The classic example is the San Andres Formation in the Texas Midland Basin (Figure 3).
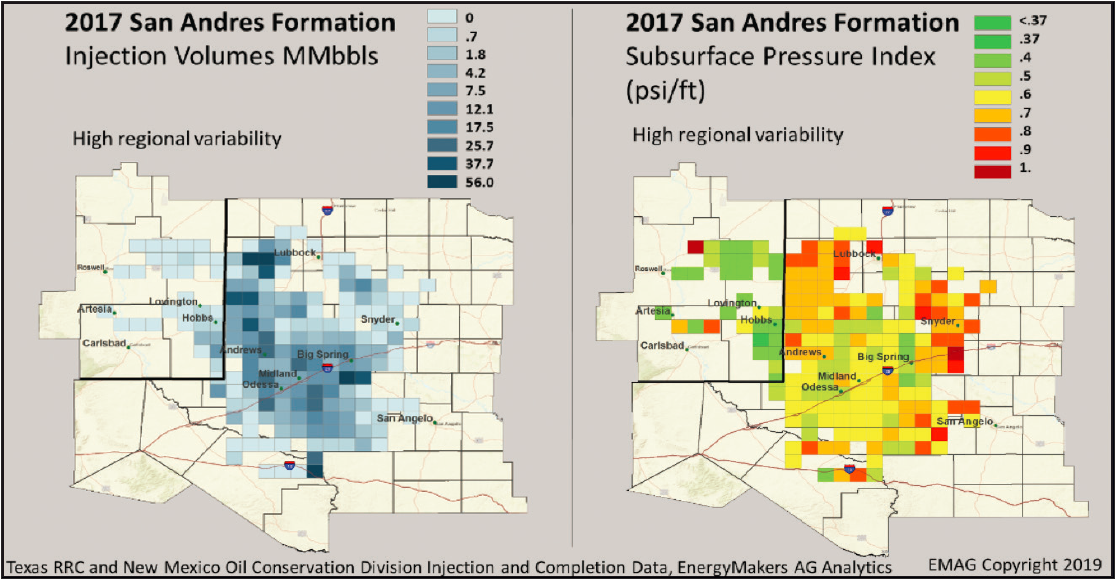
Most likely, these are regions where the injection of conventional produced water has occurred for many years, and now fluids from unconventional sources also are being injected. These bottomhole pressure changes (estimated by EnergyMakers from surface pressure and volume measurements, together with operating conditions) can be influenced by formation pressure increases (or the formation’s ability to dissipate pressure throughout the confined interval) as well as local operational practices, which could be mitigated, such as fouling or plugging from organics or solids content.
Although operators are injecting well below allowable volume and pressure limits, persistent increasing formation pressures can be an indicator that the future injection capacity (rate) of the formation may diminish with continued use. (Formation capacity reflects the formation’s ability to process and dissipate the fluid throughout the body and is rate-related, as opposed to a volumetric limit.)
This trend is readily apparent in certain shallow-moderate depth formations in the Texas Permian and in New Mexico’s Eddy and Lea counties in the Delaware Basin. In these regions, regulators are assessing new injection capacity on a case-by-case basis due to concerns about observed surface pressure increases or concerns of production interference claims by operators.
Historically, the produced water business has always been a local market. Water is disposed of, recycled or reused as close as possible to where it originated to minimize transportation and handling costs. However, intense drilling in the most lucrative plays, declining EOR applications and local SWD well availability have resulted in regional variances. If local disposal capacity is not readily available, pipelines are rapidly emerging as the more viable way to transport fluids to more receptive disposal capacity located tens to hundreds of miles away.
Are the challenges manageable?
The good news is, when taken as a whole, Texas and New Mexico have ample capacity to handle produced water safely with sufficient investment. Further, private-equity financiers are keen to finance infrastructure providers of water management assets like pipelines, disposal wells and treatment systems.
However, an escalation in water management costs can have a multiplying effect on oil extraction costs. Consider a typical Delaware Basin well with a water-oil ratio of 5.5 to 1 and the operator pays $1/bbl to transport and dispose of its produced water. For this operator, a theoretical $1 increase in produced water handling could burden its $50/bbl oil with $5.50—more than 10% of its value—in additional costs.
Future concerns about disposal capacity, combined with potentially rising water management costs will drive new behaviors for the betterment of the industry and the environment. EnergyMakers illustrates several Texas Delaware Basin development scenarios that present the opportunities (or challenges, if not addressed) in water management going forward.
Scenario cost modeling in the Texas Delaware Basin
EnergyMakers constructed a simple model of future development scenarios and associated water management volumes and costs for six Texas counties straddling the Texas Delaware Basin: Culberson, Loving, Reeves, Pecos, Ward and Winkler.
Market scenarios tested included low, medium (10% growth) and high drilling and completions (D&C) outlooks. For each scenario, the following were modeled:
- estimated legacy produced fluid base before 2018 and estimated decline;
- projected new produced and frac flowback fluid from new D&C programs;
- scenarios for produced water and flowback fluid reuse for fracturing;
- a theoretical SWD and EOR injection “practical capacity” forecast of the Delaware Basin as estimated by EnergyMakers;
- new freshwater or brackish source water used for fracturing; and
- surplus produced water (what remains after the operator has exhausted lowest cost alternatives based on operating practices).
Two of the nine scenarios modeled are examined in figures 4 and 5. EnergyMakers used a base-case growth outlook of about 10% per year for D&C of new wells in the Texas Delaware Basin. The cost assumptions were simple (Table 1).
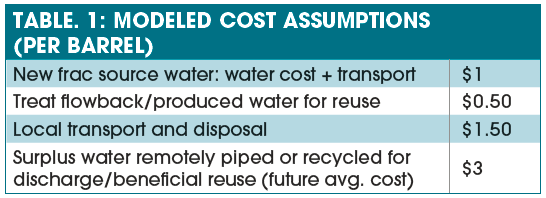
Low reuse case. A modest amount (15% of completion volumes) of produced water reused for fracturing at $0.50/bbl requires 85% makeup water from a fresh or brackish water supply at $1.50/bbl. In the year 2023 scenario, after disposing of 2.3 Bbbl locally at $1.50/bbl, 1.5 Bbbl of surplus fluids remain in the region requiring processing at $3/bbl (Figure 4).
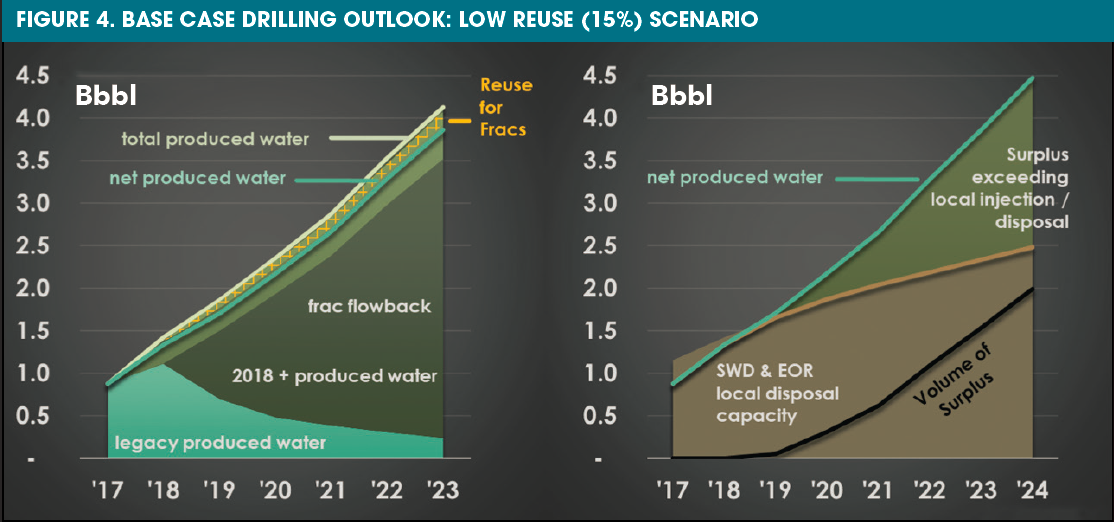
To estimate the cost impact to the operator on a per well basis, EnergyMakers assumes every well in the region behaves identically. Under this scenario, the typical 2020 well would have $2.33 million in above-specified water management costs.
High reuse case. In this case, 85% of completion volumes comprise treated produced water, requiring only 15% makeup water from a fresh or brackish water supply. In the year 2023 scenario, after disposing of 2.3 Bbbl locally, only 0.3 Bbbl of surplus fluids remain, an 80% reduction in volumes requiring more expensive processing costs (Figure 5).
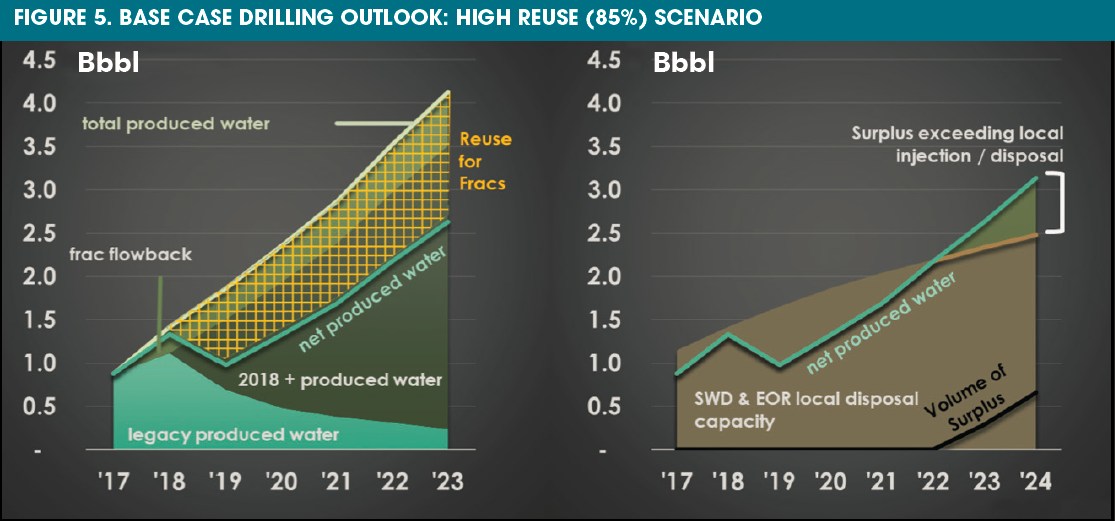
The corollary high reuse well has an estimated $1.79 million in specified water management costs, a savings of $540,000, or 23% of specified water costs per well.
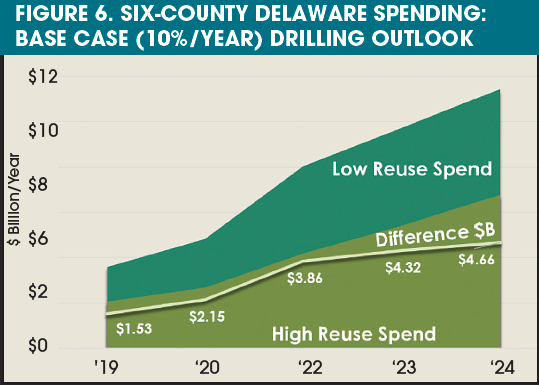
By adopting a high reuse approach (contingent on minimal impact to well productivity and performance), Texas Delaware operators would achieve more than $4.3 billion in annual savings by 2023, according to these scenarios and projections (Figure 6).
While none of these scenarios will accurately predict future Delaware volumetrics and costs, meaningful cost savings, along with minimization of disposal volumes, were obtained with the high reuse approach for every scenario explored (Figure 7).
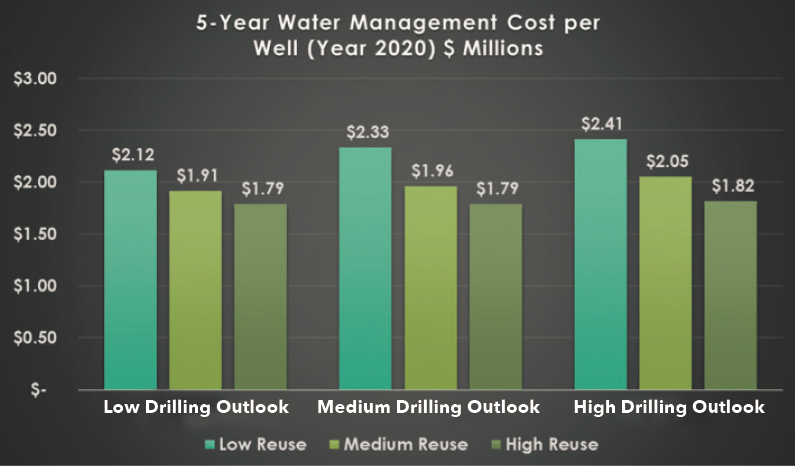
The case for reuse (15% savings between high and low reuse approaches) is important in low drilling scenarios, most likely associated with low trading prices and margins, and tight cost controls. The case for reuse is compelling in both medium and high drilling scenarios, with price savings at 23% and 25%, respectively. However, the savings apply to vastly larger volumes of activity, resulting in a greater bottom line impact on industry profit.
Early adopters: leading edge or bleeding edge?
EnergyMakers believes these price differentials are significant enough that forward-thinking operators and service providers would logically be early adaptors of solutions that deliver a sustained economic advantage.
There is a land grab or competitive mindset in certain areas perceived to have injection capacity constraints or increasing disposal costs (e.g., New Mexico sweet spots in Lea and Eddy counties, and a seismic injection zones in the Delaware Basin). Timing—and being an early mover—may provide long-term advantages over slower moving peer companies.
Lastly, anyone in the business knows that water treatment in the oil field is an inherently complex process with a learning curve. No program is likely to be an overnight success. It is advantageous to make mistakes while volumes are still manageable.
Looking forward
EnergyMakers believes reuse, recycling and smarter fluid logistics will no longer be optional. These processes will evolve to become a key determinant in price competitiveness. There are several opportunities today:
- The increased reuse of produced and flowback fluids to generate clean brines for hydraulic fracturing, as the nine Texas Delaware Basin scenarios suggest, is an alternative that likely will be the best option to reduce disposed volumes and overall water management costs.
- The industry will adopt produced water pipelines and smarter fluid logistics as the most cost-effective ways to transport fluids safely, both within and outside local operating areas. Pipeline networks will evolve that allow routing water to a managed portfolio of treatment, disposal and storage options. Intelligent planning systems, real-time monitoring and the Internet of Things (IoT) will help plan and manage the network and networked assets.
- Apply more science to disposal formation selection, SWD operation and water management. Ten years ago, the industry did not care about getting 15% more fluid into an SWD well. Going forward, that incremental 15% will have more value, and the industry is more likely to pay for systems and services that will help maintain or increase this capacity.
The larger players—both operators and water management companies—will be more scientific about how they select and operate disposal wells. The concepts of reservoir production engineering will be applied to injection formation management to keep closer tabs on injection systems and possible formation fatigue. Similarly, the industry will up its game to determine optimal treatment regimens driven by real-time influent water quality testing. Real-time monitoring, automation and IoT will be enabling technologies allowing this to happen, with the added benefit of reducing field labor costs.
Tomorrow’s areas for opportunity
While it is doubtful the high salinity states (including Oklahoma, Texas and New Mexico) will treat produced water to drinking water standards in the immediate future, EnergyMakers bets that it will start to happen—even in Texas—within the next five years. At that time, when the industry generates more produced water than the oil and gas industry can reuse or dispose of locally, the alternatives are
- Pipe the fluids even farther away to receptive disposal infrastructure;
- Treat surplus produced water for discharge, allowing water to remain in the hydrocycle, and potentially in the future contribute to replenishment of surface waters and aquifers; and
- Recycle produced water for beneficial use by other industries.
According to the Texas Water Development Board’s 2016 Plan, the two water districts straddling the Texas Delaware Basin will have combined annual water demand of 11 Bbbl/year starting in 2020 (excluding oil and gas needs), with a striking 25% of that demand projected to be unmet, a deficit of some 2.5 Bbbl/year.
With proper treatment, monitoring and ongoing safety assurance required at each step of the production chain, there is no reason that the oil and gas industry cannot evolve to contribute to the water demands of other industries. In doing so, the oil and gas industry also would enable new industry growth and diversification for local economies.
While the regulatory path to beneficial reuse is anything but simple for oil and gas stakeholders, EnergyMakers’ view of the data suggests it will be necessary if the U.S. intends to maintain its stake in energy leadership and energy independence, each of which currently relies on hydrocarbons. It is time to get the conversation started.