-
As E&P companies slow field activity, demand slows for the water used in well stimulation.
-
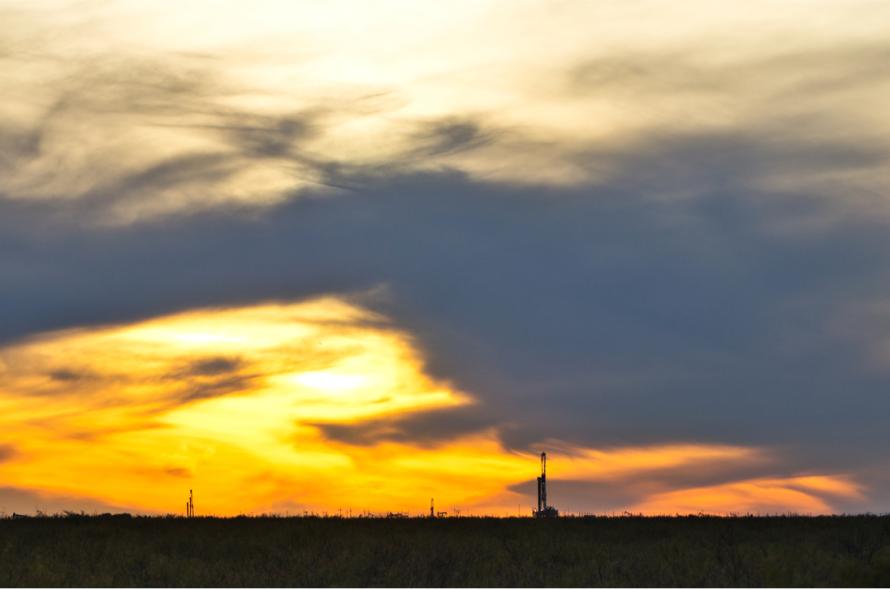
The Permian Basin serves as a proxy for water use trends in oil and gas.
-
Well count will determine the direction in water consumption for well stimulation.
The rate of change in water use for Permian Basin well stimulation is moderating. While annual water use per well for stimulation rose in the mid-single digits on average in 2018, the growth rate slowed from the low double-digit increases during the post-2015 recovery in commodity prices.
Significantly, that rate of change may turn negative for total water use by the end of the year as E&P companies release rigs and slow the pace of completions in the second half of 2019. Should this trend pan out, it would represent the first decline in aggregate annual water consumption for well stimulation in the shale era. For that to happen, water use per well would need to flatten, which appears to be underway, and the number of annual completions would have to drop. It is the latter trend that will tell the tale of the tape.
The main focus is in the Permian Basin where water use for well stimulation reached 70.7 Bgal in 2018, according to a Hart Energy examination of FracFocus.org records. Furthermore, aggregate consumption that year grew 85% over 2017. For comparison, 2018 Permian Basin water consumption for well stimulation reached 216,900- acre feet, which is loosely equivalent in annual consumption to 430,000 residents in a metropolitan setting.
Permian Basin water use trends in the 2014-2018 period are stunning. Water use per well for hydraulic fracturing in the Midland Basin rose from 2.95 MMgal per well in the first quarter of 2014 to 15.58 MMgal per well in the fourth quarter of 2018, a 428% gain, or an additional 12.6 MMgal per well. The Delaware Basin features similar trends. Water use grew from 3.1 MMgal per well in the first quarter of 2014 to 13.17 MMgal in the fourth quarter of 2018, a 324% gain, or an additional 10 MMgal per well.
What is behind the numbers? Longer laterals and more stages require more water. Secondly, the industry is moving to a greater percentage of slickwater fracture stimulation to transport larger volumes of finer mesh sand down longer wellbores. There is nuance. Lateral length, for example, is flattening in the Delaware, rising 13.7% in 2018 year over year but 9.3% year to date in 2019. Similar flattening has taken place in the Midland Basin, where annual lateral length on average grew just 3.5% in 2018 and is flat in 2019.
Both basins feature average lateral length between 2,835 m and 2,896 m (9,300 ft and 9,500 ft) for horizontal wells reflecting a trend where the average lateral has closed the gap on leading-edge laterals in terms of wellbore length.
At the same time, slickwater use in fracture stimulation shows mixed results with a slight decline in marketshare for slickwater in the Midland Basin and incremental share gains in the Delaware Basin. The results confirm anecdotal comments from the stimulation market that growth in lateral length is flattening along with proppant consumption and stage count. Thus, water consumption per well for hydraulic fracturing should flatten. In that case, well count will determine the direction in water consumption for well stimulation.
In aggregate, the Permian Basin used 1.683 Bbbl of water in 2018 for well stimulation. Permian Basin water use is an $11 billion industry divided between water injected for stimulation and produced water for reuse or disposal. Produced water is projected to reach 8.7 MMbbl/d in the Permian Basin in
2019, or 3.2 Bbbl for the year. That trend, which merits separate review, is projected to increase regardless of the forces impacting water use for well stimulation.
Recommended Reading
For Sale, Again: Oily Northern Midland’s HighPeak Energy
2024-03-08 - The E&P is looking to hitch a ride on heated, renewed Permian Basin M&A.
E&P Highlights: Feb. 26, 2024
2024-02-26 - Here’s a roundup of the latest E&P headlines, including interest in some projects changing hands and new contract awards.
Gibson, SOGDC to Develop Oil, Gas Facilities at Industrial Park in Malaysia
2024-02-14 - Sabah Oil & Gas Development Corp. says its collaboration with Gibson Shipbrokers will unlock energy availability for domestic and international markets.

E&P Highlights: Feb. 16, 2024
2024-02-19 - From the mobile offshore production unit arriving at the Nong Yao Field offshore Thailand to approval for the Castorone vessel to resume operations, below is a compilation of the latest headlines in the E&P space.
TotalEnergies Acquires Eagle Ford Interest, Ups Texas NatGas Production
2024-04-08 - TotalEnergies’ 20% interest in the Eagle Ford’s Dorado Field will increase its natural gas production in Texas by 50 MMcf/d in 2024.