
(Source: TGS/Hart Energy)
Learn more about Hart Energy Conferences
Get our latest conference schedules, updates and insights straight to your inbox.
There are many uncertainties in the estimation of parameters, such as the volume of clay, water saturation and porosity for unconventional plays, especially where multiple zones need to be characterized simultaneously. These challenges are discussed with reference to a dataset from the Delaware Basin where the Bone Spring, Wolfcamp, Barnett and the Mississippian formations are the prospective zones.
Usually gamma ray logs are used to determine the volume of shale (Vsh) by computing gamma ray index first, which is then transformed into the Vsh via linear or nonlinear empirical relationships. The gamma ray index needs at least one or more points on clean sand and shale within the interval under investigation. In the absence of such values, which is likely to be the case for Bone Spring and Wolfcamp formations, the computation could fall apart. Additionally, this methodology is not preferred for a formation where the highenergy depositional environment of Bone Spring and Wolfcamp formations exists. In such a scenario, the difference between neutron-porosity and density-porosity serves as an estimation of Vsh. By implementing different approaches on well log data over a 3-D seismic volume from the Delaware Basin, there is uncertainty associated with the determination of the volume of shale depending on the type of method adopted. The rule of thumb is to use the minimum value of Vsh estimated using the above approaches or the one that shows the maximum correlation with available X-ray diffraction data.
Any well log evaluation for estimation of water saturation in shales will depend on the type of shale and its volume. Various empirical equations (e.g., Archie’s equation and Simandoux equation) have been proposed, but it remains unclear which equation should be used to determine water saturation for unconventional plays.
In a given formation, the porosity of that formation can be calculated from the bulk density using equation ø = (ρm – ρb)/(ρm – ρf ) if the matrix density (ρm) and the fluid (ρf ) are known. Usually a constant value of matrix density (sandstone, limestone and dolomite) is used. While such an assumption works well for conventional plays, it does not hold true in the Delaware Basin where formations of interest (Bone Spring, Wolfcamp and Barnett) are composed of varying amounts of quartz, calcite, dolomite, kerogen and clay minerals. This results in grain densities varying from 2.5 g/cu. m to 2.7 g/cu. m and pose a major challenge in the estimation of porosity. An uncertainty range of 0.2 g/cu. m can increase the error bar on porosity by 6%, which can drastically impact resource estimation. Different practitioners have demonstrated the overestimation of porosity using the above equation, which questions the validity of the equation in any exercise.
Besides the large uncertainties in the estimation of reservoir properties mentioned above, the absence of enough shear curves makes it challenging to execute rock physics analysis in the complex depositional environment of the Delaware Basin. A statistical approach was followed, entailing a graphical cross-plot method for determination of the volume of shale and effective porosity in a formation.
Utilizing a robust statistical approach for characterization of unconventional plays
The approach starts with cross-plotting of neutronporosity (ØN) and density-porosity (ØD) curves covering a broad zone of interest (Figure 1), where five deep wells (W1-W5) were used. Three points are marked on this cross-plot, namely:
• Point F that represents fluid or water point, where ØD = ØN =100%;
• Point M that represents matrix point, where ØD = ØN = 0; and
• The shale point SH.
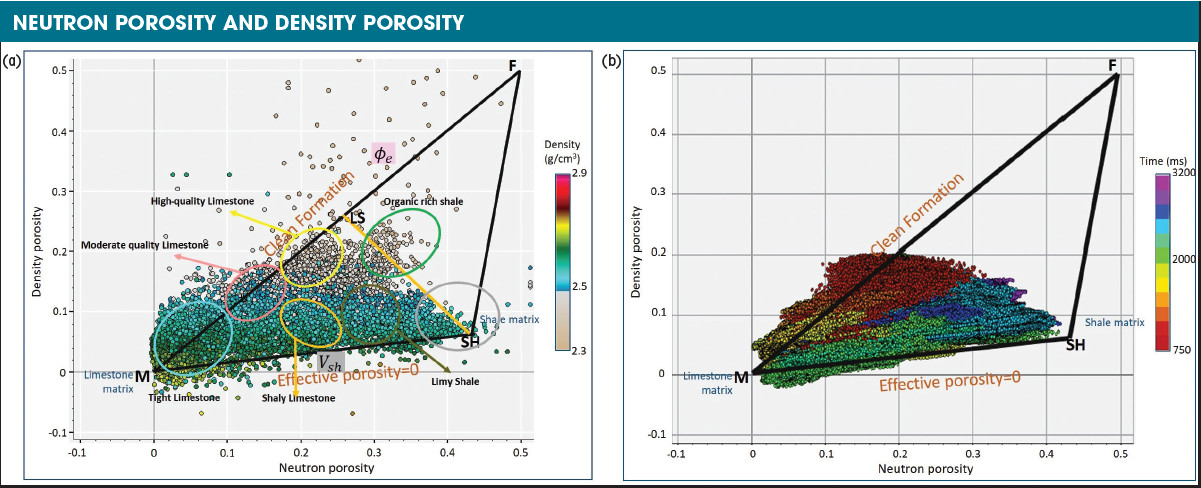
The well data entering the cross-plot need to be corrected for the presence of hydrocarbons, and datapoints representing clean formations will fall along the line MF, their location indicating the effective porosity. Points along the line M-SH represent the volume of shale with zero effective porosity. Being acquainted with this, the points along the clean formation line have been interpreted as tight limestone, moderate-quality (calcareous) limestone and high-quality (siliceous) limestone. Additionally, points along the line M-SH have been interpreted as coming from shaly-limestone, limy-shale and clay-rich shale. Similarly, the points along line SH-LS are interpreted as coming from organic-rich shale. The back-projection of these facies on the well curves reveals that the clay-rich shale and organic-rich shale facies seem to be coming from the Barnett to Mississippian interval. The shaly limestone and limy-shale facies are observed within the Wolfcamp zone. Favorable comparisons were noticed for all the well-defined facies with the mud-log interpretation available for a couple of wells, which lent confidence in the facies defined.
Next, seismic data were considered for predicting facies volume. For doing so, a multi-attribute regression approach was followed for obtaining ØN and ØD from seismic data using Poisson’s ratio, E-rho, P-, S-impedances and the seismic data attributes as input data. The availability of sparsely uniform well control in terms of ØN and ØD log curves over the 3-D seismic volume motivated TGS for this approach. An equivalent cross-plot to Figure 1a (plotted using well log data) from the predicted ØD and ØN volumes along an arbitrary line that passes through different wells are shown in Figure 1b. A striking similarity between the two cross-plots lends confidence in the approach that has been used. Further, the facies defined above in the ØN- ØD space were mapped using these predicted ØD and ØN volumes. A representative section through the facies volume passing through the different wells is shown in Figure 2. The carbonate content in Bone Spring increases from the western to the eastern part of the line, which is as per the expectation and geological knowledge of the area. A clay-rich and organic-rich (prospective) shale facies can be seen on the upper and lower portion of the Barnett, respectively. The limy-shale and shaly-lime facies are seen in the interval from Wolfcamp to Barnett.
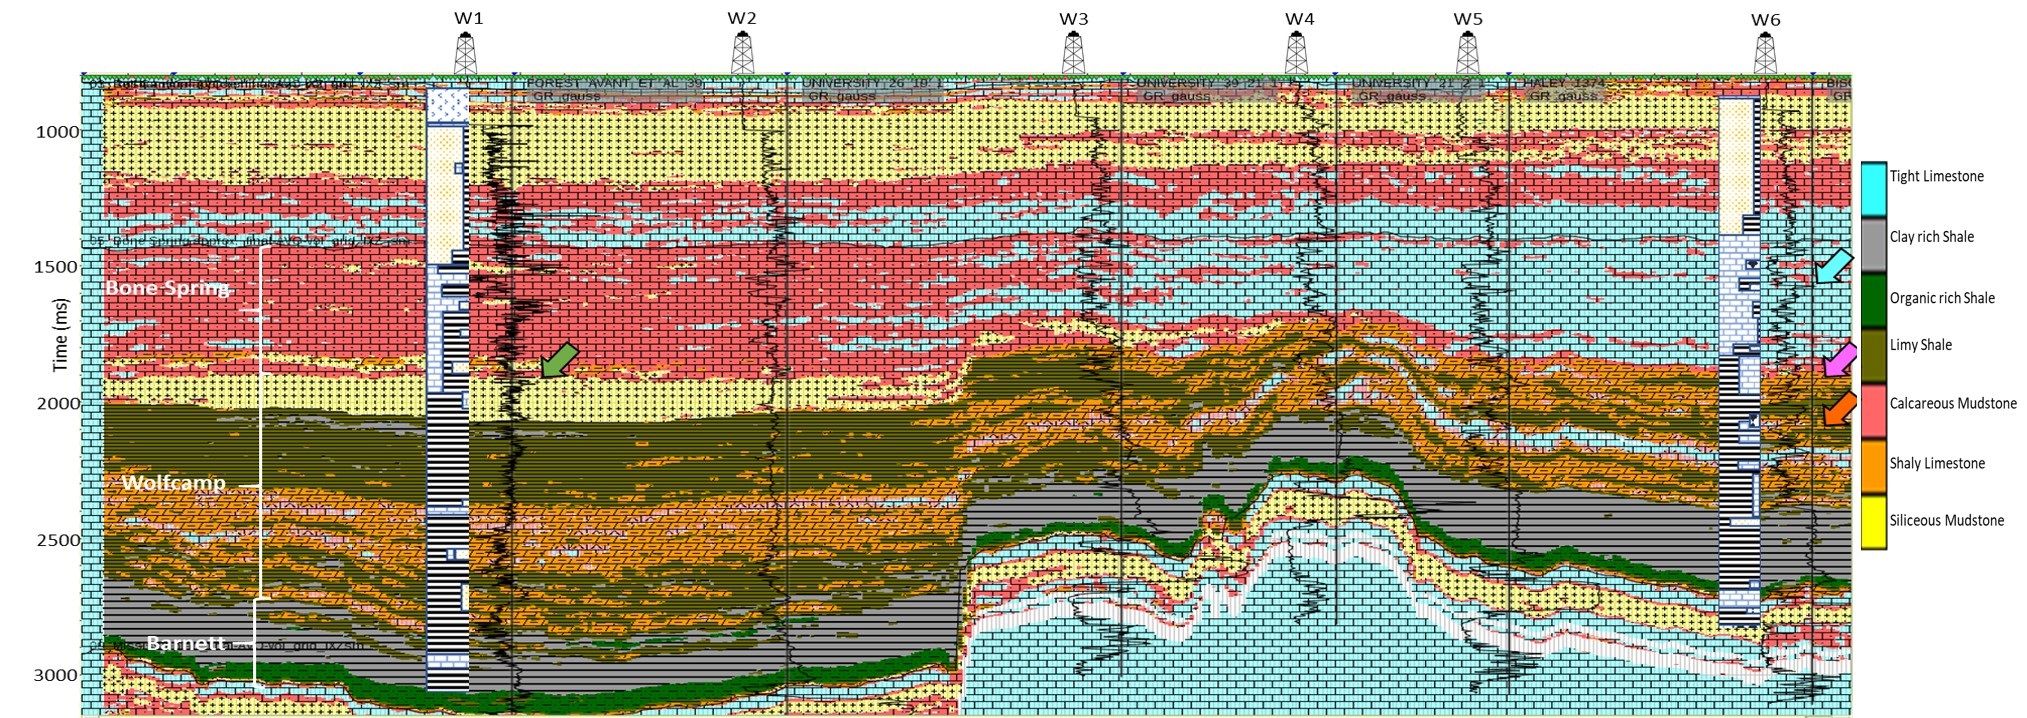
To gain confidence in the facies analysis described thus far, the available mud log data for the other wells on the 3 D seismic volume were sought. Lithostrips obtained for two of the wells were laid over this section. The one-to-one correlation is noticed between the shale in the Barnett, Wolfcamp units and more calcareous and siliceous mudstone with tight limestone in the Bone Spring interval. Such a correlation between the seismic facies and the independent information coming from the mud log records lends confidence in the analysis carried out.
Recommended Reading

Exxon Mobil Guyana Awards Two Contracts for its Whiptail Project
2024-04-16 - Exxon Mobil Guyana awarded Strohm and TechnipFMC with contracts for its Whiptail Project located offshore in Guyana’s Stabroek Block.

Deepwater Roundup 2024: Offshore Europe, Middle East
2024-04-16 - Part three of Hart Energy’s 2024 Deepwater Roundup takes a look at Europe and the Middle East. Aphrodite, Cyprus’ first offshore project looks to come online in 2027 and Phase 2 of TPAO-operated Sakarya Field looks to come onstream the following year.

E&P Highlights: April 15, 2024
2024-04-15 - Here’s a roundup of the latest E&P headlines, including an ultra-deepwater discovery and new contract awards.
Trio Petroleum to Increase Monterey County Oil Production
2024-04-15 - Trio Petroleum’s HH-1 well in McCool Ranch and the HV-3A well in the Presidents Field collectively produce about 75 bbl/d.

Trillion Energy Begins SASB Revitalization Project
2024-04-15 - Trillion Energy reported 49 m of new gas pay will be perforated in four wells.