
(Source: Energy Information Administration)
In 1949 the 149 million residents of the U.S. consumed 4.97 trillion cubic feet (Tcf) of natural gas. In 2020 the population had increased to about 330 million, more than double, but gas use had soared by a factor of six to 30.48 Tcf.
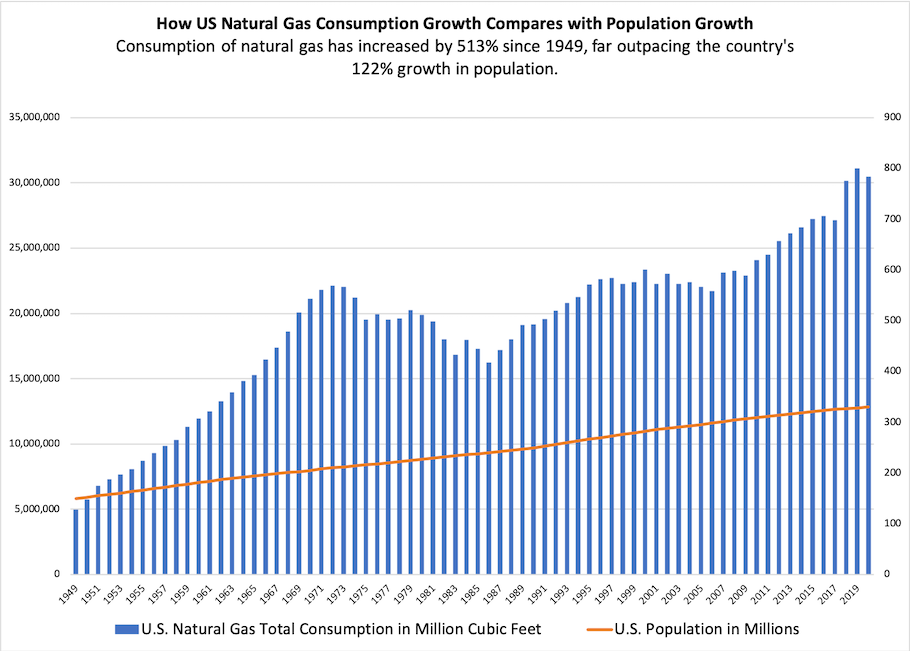
The per capita increase is not surprising. The U.S. economy grew in spectacular fashion during that period, and there are many more uses for natural gas in the modern world.
It is, however, interesting to see how usage has changed. Since 2000 volumes dedicated to industrial, commercial and residential uses have pretty much held steady. Natural gas use for electrical power generation, however, has more than doubled.
Ramanan Krishnamoorti, chief energy officer with the University of Houston, pointed to two major components of electricity generation that align with natural gas. The first is how gas has been used to substitute for coal in base load power, which is the minimum level of demand on an electric grid over a particular period (a week, for example). Gas is also valuable because it can be used for peak or on-demand power. This could be the case during a summer heat wave, when demand is high to keep air conditioning units functioning. So when demand picks up, natural gas can rapidly respond to it, unlike wind power during non-windy conditions or solar power at night.
“The second component of this transformation from the shale revolution has been how we use natural gas in other industries,” Krishnamoorti said. “For instance, the entire plastics industry is largely [dependent on] natural gas rather than crude oil. Until 2005-2006, almost all chemicals and plastics were made from crude oil. Natural gas was usually just burned for fuel value.”
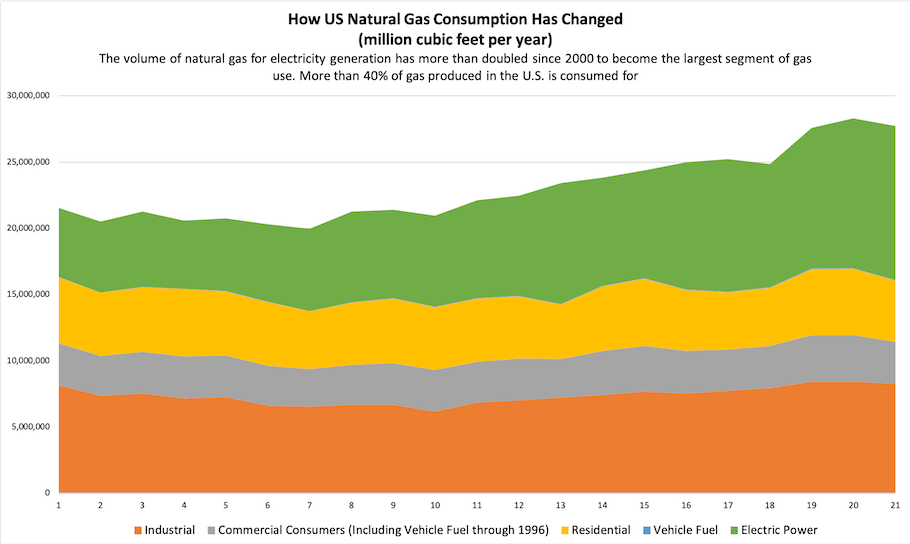
The transition to gas as the leading fuel for electric power generation happened because utilities chose to purchase natural gas instead of coal. Those decisions were based on sound economics and are directly linked to the effects of the shale revolution. The constant in the charts can be seen starting in 2005-2006. A sharp increase in shale gas production brings down the price of natural gas, triggering a sharp increase in consumption.
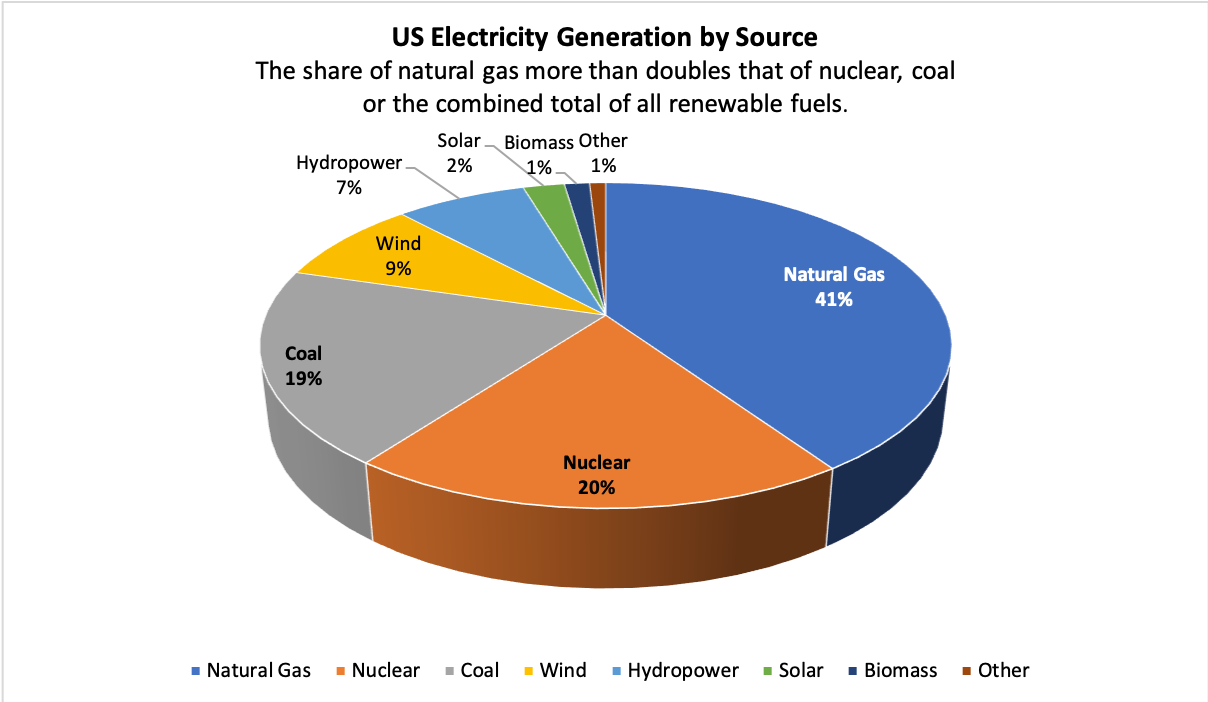
As of 2021, natural gas accounted for more than 40% of electrical generation in the U.S., more than double that of all renewable fuels combined, as well as nuclear power and coal. Nuclear power capacity reached its peak in 1990 and generation topped out in 2004. A new nuclear reactor has not come online in the U.S. since 2016. Two reactors, the first to be built from scratch in the last 30 years, are under construction in Georgia, but they are years overdue and billions of dollars over budget. Coal consumption for electricity generation fell 53% between 2011 and 2020 as the price of natural gas fell.
Total electrical generation by renewable sources—which include wind, solar, wood, landfill gas, other types of biomass, geothermal and hydroelectric—has grown by 54% since 2011. That means the substitution of cleaner fuels like natural gas and renewables for dirty fuels like coal has been underway for a decade.

More burn for the buck
The economics of energy have been favorable to natural gas, hence its growing share of the energy mix for power generation. But it’s more than that.
One of the major impacts of the shale revolution was that crude oil and natural gas production no longer moved in lockstep, so neither did oil and gas prices (read "A Sense of Security"). When unconventional production methods allowed energy companies to drill specifically for natural gas in shale fields, production of gas was no longer restricted to associated gas (the gas that comes with oil production).
Prior to 2005-2006, the price ratio of gas and oil was 1:7. In other words, if the benchmark measurement of gas, 1 million British thermal units (MMBtu), cost $1, then the benchmark measurement of oil, a 42-gallon barrel, would cost $7. This was largely consistent with the calorific value of gas and oil—a barrel of oil corresponds to about 6 MMBtu.
To grasp how much has changed, consider that the price of a barrel of crude oil at the start of the fourth quarter of 2021 was about $78. By the pre-shale revolution 1:7 ratio, the price of natural gas should have been $11.14/MMBtu.
Not even close.
At $5.84/MMBtu, the price of gas was about half of that, even as it was experiencing an unusual uptick on the market. The ratio was above 1:13, very much to the advantage of consumers.
And it’s not just the market price.
“You get much higher calorific value than you get out of crude oil,” Krishnamoorti said.
When it comes to the essential requirements of on-demand electricity, natural gas offers advantages in conductivity and storage as well—and not just compared to crude oil but compared to any fuel in the mix today.
“Cent for cent,” he said, “natural gas provides both more storage and kilowatts than crude oil, coal or any of the renewables.”
The upshot
- Natural gas has assumed an ever-greater role in the U.S. energy system and in electric power generation in particular.
- The reasons are abundance and affordability.
- Natural gas provides energy more cheaply than any other major U.S. fuel source.
Click here to continue reading the "America's Natural Gas" report.
Recommended Reading

TotalEnergies Starts Production at Akpo West Offshore Nigeria
2024-02-07 - Subsea tieback expected to add 14,000 bbl/d of condensate by mid-year, and up to 4 MMcm/d of gas by 2028.

E&P Highlights: Feb. 5, 2024
2024-02-05 - Here’s a roundup of the latest E&P headlines, including an update on Enauta’s Atlanta Phase 1 project.

CNOOC’s Suizhong 36-1/Luda 5-2 Starts Production Offshore China
2024-02-05 - CNOOC plans 118 development wells in the shallow water project in the Bohai Sea — the largest secondary development and adjustment project offshore China.
US Drillers Cut Oil, Gas Rigs for First Time in Three Weeks
2024-02-02 - Baker Hughes said U.S. oil rigs held steady at 499 this week, while gas rigs fell by two to 117.

Equinor Receives Significant Discovery License from C-NLOPB
2024-02-02 - C-NLOPB estimates recoverable reserves from Equinor’s Cambriol discovery at 340 MMbbl.