Learn more about Hart Energy Conferences
Get our latest conference schedules, updates and insights straight to your inbox.
The unconventional shale resource revolution has been underway in North America for some time, and before the current slump in oil price, shale E&P operators would commonly “optimize” a drilling program by installing a few heavily monitored science wells to establish a standard well and completion design for the many wells that followed. However, the wide variation in subsequent well production performance strongly supported the case for capturing individual well data. Unfortunately, in the current depressed market conditions, existing techniques are either deemed too costly or do not yield actionable data in the time frame required to make key decisions that can impact well productivity.
Cost-effective development of unconventional shale resources requires addressing three specific objectives: identifying the subsurface location to access the sweet spots for lateral placement, identifying the kickoff point to land the lateral/horizontal section in the zone of interest based on fluid phase to be exploited and deciding the locations of the hydraulic fracture stages. All three objectives require an understanding of inorganic mineral and organic composition as well as rock fabric. In this article WellDog presents a new capability, Reservoir RockHound (RRH), which uses Raman spectroscopy to characterize these rock properties.
Raman spectroscopy for petrology
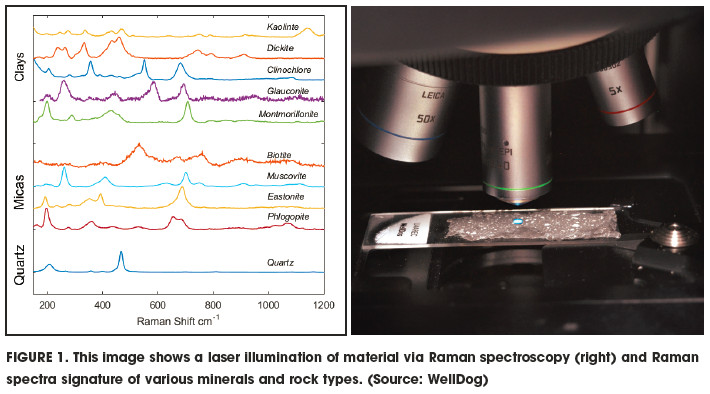
Raman spectroscopy is an optically based molecular-selective technique useful for identifying and quantifying well-defined chemical targets such as methane or CO2 or many minerals. In Raman spectroscopy, monochromatic laser illumination of a material results in the inelastic scattering, or Raman scattering, of that light. A small portion of the laser light changes frequency (i.e., color) due to interactions with molecular vibrations in the molecules. The shift in energy therefore provides information about the vibrational modes in the system, revealing the molecular bonding and structure of the molecules, which is ultimately what is used to perform mineralogical analysis. The power of Raman spectroscopy stems from the ability to uniquely identify multiple analytes present in the illuminated spot and to precisely quantify the amounts of each analyte present in that spot using advanced chemometrics analysis techniques. Figure 1 shows the Raman signature for common quartz, mica and clay minerals, with the Raman
peaks being sharp, well defined and easy to resolve in mixtures of minerals. The height of individual Raman peaks corresponds to the amount of each mineral present in the spot illuminated by the laser.
Raman spectroscopy, rock characterization
Shale rocks exhibit complex geological, geochemical and petrophysical heterogeneities at all scales both vertically and laterally. Shales, therefore, typically present an enormous number of possible completion targets. With gross packages ranging from many tens to hundreds of feet, thick shale units present an unusual challenge in selecting completion targets for operators. There is thus a need to characterize these variations in the vertical as well as lateral sections of development wells in a cost-effective manner to guide key decisions. The resulting actionable data can be used to locate sweet spots in shale formations, aid fracture cluster and stage spacing, guide design of stimulation fluid recipes and identify kickoff points to land laterals.
Traditionally, core samples are subdivided and various parts sent to different laboratories to determine the inorganic composition, total organic carbon (TOC), thermal maturity and rock texture using a variety of analytical techniques and involving a wide range of apparatuses. Until now, no one single technique or apparatus was available to determine all these rock properties and attributes, and many required destruction of the original sample. Furthermore, traditional formation evaluation techniques are not able to distinguish between certain clay types or differentiate bitumen from kerogen. This can lead to erroneous assessment of thermal maturity, rock grain density, kerogen type, mobile hydrocarbon composition and residual oil saturations.
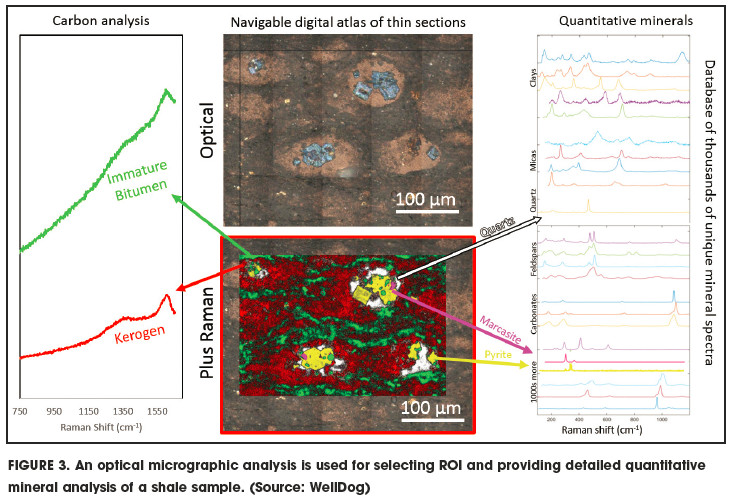
The RRH Raman spectroscopy technique has been developed to address this limitation. Raman-based laboratory petrography and geochemistry analyses can determine rock geochemistry and fabric using a single automated, prescriptive and highly objective sampling and analysis methodology on thin sections, core samples and drill cuttings. The apparatus acquires high-resolution (1-μ) optical petrographical and hyperspectral images that are seamlessly superimposed in a digital atlas that is then mined to evaluate shale geochemistry, rock texture (fabric) and paleoecological indicators. The automated process eliminates both human error and human subjectivity from evaluation of variability and distribution of these parameters. Figure 2 is an example illustration of the results of a shale sample attained via the following process:
a. The sample is placed into the system;
b. Optical imaging is performed at various magnifications to create a composite optical image of the entire sample or a particular region of interest (ROI), which is placed in a digital atlas;
c. Raman spectra are then collected at various areas across the sample. This can be done at singular points, across a line or in a 2-D array (area map). Spectra are analyzed to identify the various minerals, organics, etc., and map these against the compiled optical image; and
d. These compiled layers and images can then be analyzed further to gain insight into distribution, weight percent of the constituents, grain information, rock texture, etc.

Figure 3 further illustrates the use of optical micrographic analysis for identification of ROIs within a shale sample. For the specific ROI, hyperspectral Raman maps are acquired for objective and quantitative analysis of mineral content, TOC, differentiation of carbon phases (bitumen and kerogen types illustrated in a later example; Figure 3) and paleoecological assemblages.
One-stop testing platform
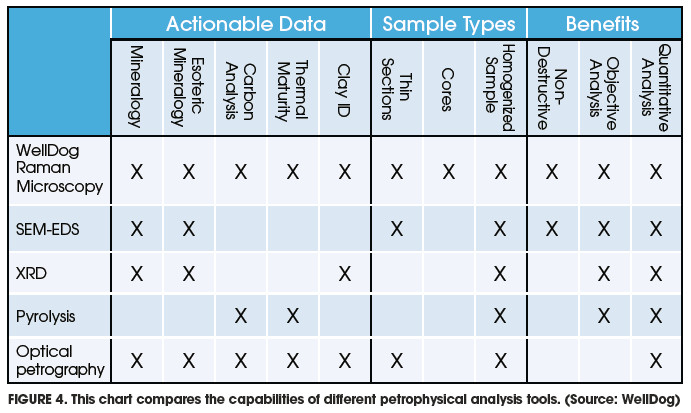
Raman spectroscopy enables geochemical and petrological measurements and rock fabric information to be acquired on individual samples using a single instrument with nondestructive testing protocols. This work can be accomplished on a variety of sample types, including thin sections, drill cuttings and cores. The method is sensitive to molecular structure and often is referred to as a chemical fingerprinting technique. It is able to differentiate clay types, precisely identify and quantify composition of most inorganic minerals, differentiate carbon forms such as kerogen and bitumen, identify kerogen types and determine kerogen thermal maturity. The scanning process also has very high spatial resolution (on the order of the excitation laser wavelength), with Raman spectra acquired in seconds. Data analysis is greatly accelerated through use of automated algorithms with technician oversight. Routine measurements include bulk inorganic mineralogy, mineralogy distribution, TOC, hydrocarbon biomarkers (presence and prevalence of paleoecological assemblages), thin section optical and false color micrographs, and grain and pore size distribution (1-μ limit). Nonroutine tests include full mineralogy distribution, distinguishing kerogen from bitumen, identifying kerogen type(s), kerogen thermal maturity, and grain shape and orientation (1-μ limit). Figure 4 provides a comparison of the capabilities between the various laboratory techniques.
Acknowledgement
The authors would like to acknowledge the collaboration and helpful discussion with members of the Hess oil and gas team.
References available.
Recommended Reading

Seadrill Awarded $97.5 Million in Drillship Contracts
2024-01-30 - Seadrill will also resume management services for its West Auriga drillship earlier than anticipated.

TotalEnergies Starts Production at Akpo West Offshore Nigeria
2024-02-07 - Subsea tieback expected to add 14,000 bbl/d of condensate by mid-year, and up to 4 MMcm/d of gas by 2028.

Well Logging Could Get a Makeover
2024-02-27 - Aramco’s KASHF robot, expected to deploy in 2025, will be able to operate in both vertical and horizontal segments of wellbores.

Shell Brings Deepwater Rydberg Subsea Tieback Onstream
2024-02-23 - The two-well Gulf of Mexico development will send 16,000 boe/d at peak rates to the Appomattox production semisubmersible.

E&P Highlights: Feb. 26, 2024
2024-02-26 - Here’s a roundup of the latest E&P headlines, including interest in some projects changing hands and new contract awards.