Presented by:
![]()
Editor's note: This article appears in the E&P newsletter. Subscribe to the E&P newsletter here.
As more countries adopt net-zero carbon emission goals, the fossil fuel share of total world energy supply is expected to decline. This contraction of oil and gas production is expected to lead to an even greater focus on identifying new resources and play concepts that lie close to existing infrastructure. Shallow and previously overlooked plays in younger sedimentary sequences are becoming increasingly attractive targets.
In this setting, prestack seismic methods play a key role in developing and ranking prospects, which often show a strong amplitude response. Early exploration wells often log these intervals on the way to deeper targets, and they provide critical elastic rock property data needed to understand and calibrate seismic amplitudes. With only limited rock property information, prestack models can establish the reliability of the amplitude-versus-offset (AVO) signal in the data and guide the interpretation approach. AVO attributes and inversion techniques can both be used to validate pre-drill hypotheses and build confidence in predrill prediction of reservoir rock and fluid properties.
Sharp Reflections illustrates this phased analysis approach with a recent exploration prospect in the Miocene-aged Utsira Formation offshore Norway. Prestack techniques help to establish the seismic signature of high-porosity sandstone reservoirs and assess the likelihood of gas versus oil fill using facies-based prestack Bayesian inversion.
Case study: Utsira Formation reservoirs in northern North Sea
Discovery of the giant Johan Sverdrup Field has triggered active, infrastructure-led exploration in this area, at all stratigraphic levels. Miocene-aged sandstones of the Utsira Formation are present in this area, defining a broad NS-trending band that extends along much of the southern Norwegian coast. Stratigraphically, these can be interpreted as basinal lowstand deposits, overlain by thick prograding wedges of Pliocene age.
Detailed 3D interpretation on a merged 3D survey east and north of Johan Sverdrup reveals a prospective area where a relatively thick Utsira Formation is present in the north-central part of the survey (Figure 1). The upper Utsira is dominated by high-amplitude reflections, which are a few seismic cycles thick. In this area, the strongest reflections appeared to be localized near the top of what looks to be a major mass flow deposit. Differential compaction of the mass flow complex formed a distinct structural closure, with more than 40 m of relief.
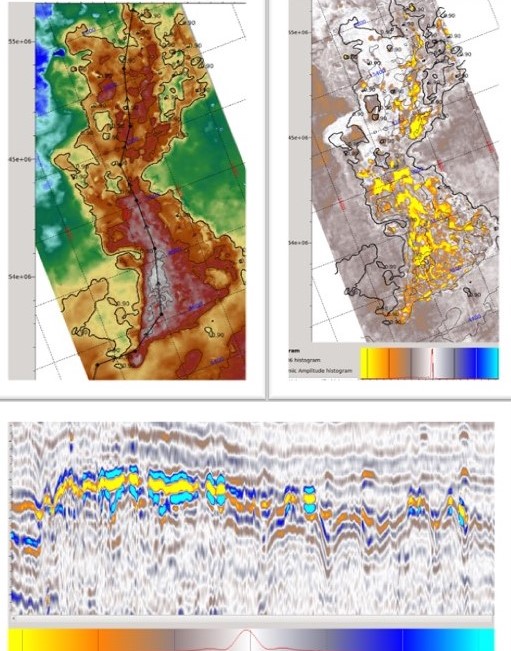
Internally, the Utsira Formation amplitude patterns are complex, suggesting an interplay of heterogenous lithology, fluid and tuning effects. These needed to be unravelled to properly assign predrill risks to presence of reservoir, presence of hydrocarbons and likely hydrocarbon phase (gas or oil).
Rock property calibration
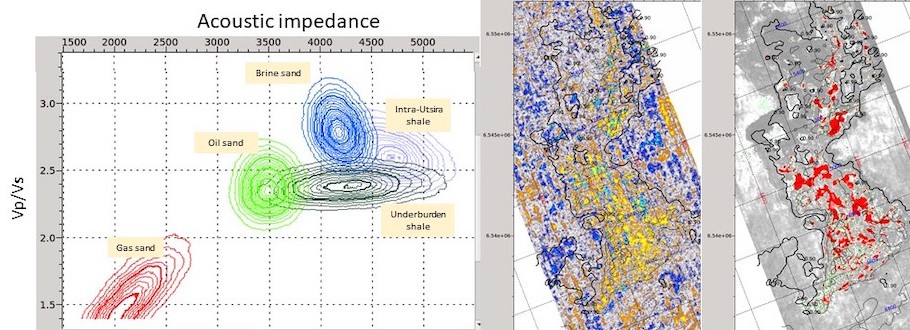
Lundin Petroleum supplied the seismic, well data and rock property information. From there, forward seismic modeling was carried out to support the hypothesis that bright amplitudes at the top of the mass flow complex result from reflections at the top and base of high-porosity Utsira sandstones. Neither of the two exploration wells in the 3D survey encountered Utsira Formation sandstones. Instead, several wells in exploration Block 16/4 (due west of the 3D survey area) were used to establish velocity and densities for gas, oil and brine-filled Utsira Formation sands as well as overlying and underlying shales (Figure 2).
Models with oil or gas-filled sands both predict strong top and base sand amplitudes at all angles. Oil sands are predicted to be somewhat less reflective than gas (depending on oil properties) and dim slightly with reflection angle. In contrast, brine sands are expected to show only a weak near angle response and dim more rapidly with angle. While both acoustic impedance and Vp/Vs response should both help differentiate facies, acoustic impedance alone might be sufficient to distinguish between brine, oil and gas cases.
Prestack amplitude interpretation
Prestack gathers were used to compute amplitude-versus-angle (AVA) attributes and angle stacks for quantitative analysis. The AVA gradient map at the interpreted top Utsira Formation shows stripy amplitude banding that was not observed on any other amplitude map (Figure 2). These are aligned in the inline direction and indicate acquisition footprint contamination. These persist even after prestack data conditioning and suggest that AVA gradient reflectivity might not be sufficiently reliable to track changes in Vp/Vs reflectivity contrast on specific events. As a result, quantitative attempts to predict facies from simultaneous prestack inversion are likely to rely heavily on acoustic impedance contrasts on near-angle stacks.
AVO inversion
A detailed seismic reflectivity analysis suggests these map view amplitude patterns might be explained by a geologic model with narrow sand fairways that are sandwiched by shales above, below and laterally.
To investigate this in more detail, Sharp Reflections carried out prestack seismic facies inversion using a simple sand-shale model, with any combination of brine, oil or gas sand possible.
The inversion produces probability volumes for each of these litho-classes. It was found that the only model that predicted the very bright observed amplitudes requires the gas sand litho-class within those areas (Figure 2). This does not imply that they are gas sands but shows that elastic properties are most consistent with the gas sands included in the rock physics model.
Elsewhere, the results suggest a shale-dominated unit and predicts a low likelihood of encountering either brine sands or oil sands. This may be due to the use of litho-classes and fluid properties obtained some distance from this area, which may not capture the fine detail of local variations. Nonetheless, if oil or brine sands are present but unrecognized by the inversion, their elastic properties presumably have greater contrasts with the shales than was seen in the Block 16/4 area.
In the prospect, likely gross gas sand volumes are estimated to be nearly 50 Mm3 with an estimated column height of 40 m, implying that the container is filled to spill point. Using average porosities of 36% (obtained from the Block 16/4 wells), this translates to a pore volume of 16.6 Mm3. This is an attractively sized oil prospect, though less interesting in the gas case.
Conclusion
Well 26/10-1 tested the hydrocarbon potential in the Miocene Utsira Formation sand. The well encountered Utsira Formation gas sand with very good reservoir quality. Pressure measurements imply a gas column of 36 m at the well, consistent with prediction from the prestack inversion.
This result highlights the value of probability-based prestack facies inversion to evaluate new play concepts in maturing exploration areas. Sharp Reflections’ Big Data software permits execution of this integrated processing and interpretation workflow efficiently, using all prestack gathers.
Prestack methods allowed more rigorous testing of reservoir predrill scenarios and to assess the probability of gas versus oil. Rigorous quality assurance of AVA amplitudes clearly highlighted the limitations of using AVA amplitude gradients to discriminate facies. Nonetheless, confident facies prediction was achieved, presumably because near-angle data permitted fairly accurate acoustic impedance estimation.
This example shows that even in new plays, quantitative inversion-led techniques can reduce drilling risk by validating predrill reservoir scenarios. Quantitative amplitude interpretation plays an even more important role in appraisal and field development, as the rock property data collected in wells permit more quantitative amplitude calibration. Prestack methods stand to grow in adoption as companies seek to improve interpretation accuracy and increase recovery from all fields.
RELATED CONTENT:
July 26, 2021 AI and Ultralong Offsets Updating the Story of Utsira OBN
July 23, 2021 Visualization Platforms Create a New Look for Field Services Project Management
July 20, 2021 Reading Between the Lines of Subsurface Data
July 13, 2021 Exploration: Leveraging Digitalization to Maximize Results in the Field
June 22, 2021 Geomechanical Rock Properties Prediction from Seismic Data
June 14, 2021 Artificial Intelligence Platform Accelerates Reservoir Opportunity Identification
Recommended Reading
US EPA Expected to Drop Hydrogen from Power Plant Rule, Sources Say
2024-04-22 - The move reflects skepticism within the U.S. government that the technology will develop quickly enough to become a significant tool to decarbonize the electricity industry.

Exclusive: ‘Regulatory Tsunami’ a Top Priority for American Producers, Says AXPC’s Bradbury
2024-04-22 - Regulatory considerations have significant implications for how oil and gas companies evaluate risk, and it’s a top priority for American energy producers right now, said American Exploration & Production Council CEO Anne Bradbury at CERAWeek by S&P Global.

Biden Administration Criticized for Limits to Arctic Oil, Gas Drilling
2024-04-19 - The Bureau of Land Management is limiting new oil and gas leasing in the Arctic and also shut down a road proposal for industrial mining purposes.

Exclusive: The Politics, Realities and Benefits of Natural Gas
2024-04-19 - Replacing just 5% of coal-fired power plants with U.S. LNG — even at average methane and greenhouse-gas emissions intensity — could reduce energy sector emissions by 30% globally, says Chris Treanor, PAGE Coalition executive director.