Despite the prolific use of hydraulic fracturing, an understanding of fracture growth and the overall fracture network continues to be elusive. Like the unassembled pieces of a puzzle, knowing how the fractures fit together to form a complete picture of the network often relies on preconceived ideas. The reason is simple: older fracture map technology, which would more clearly bring the picture into view, is complicated, intrusive and expensive. Operators typically acquire fracture map data for less than 10% of U.S. onshore unconventional wells.
The effect of this limited knowledge about the fracture network has prevented operators from making fast, informed decisions that would validate the completion design with minimal operational risk and cost. Based on large amounts of data and analysis, Reveal Energy Services’ new fracture map enables operators to understand each unit’s fracture geometry. Operators are improving decision-making about well spacing and each completion as they move forward on field development.
An Eagle Ford operator utilizing this approach evaluated several completion designs with the goal of reducing costs and the number of stages by increasing stage length while still achieving the same fracture geometry as the historical design. The pressure-based fracture map and the operator’s better decisions reduced completion costs by 20%.
Enhanced fracture diagnostics
The operator had completed several wells in the Eagle Ford using completion and production data to establish the baseline design. However, the operator wanted a streamlined approach for its next phase.
Older fracture map methods, which are five to 10 times the cost, take considerably longer to generate. Because of this extended wait time to receive a fracture map, an operator typically will have completed several additional pads without knowing the fracture geometry of the first pads. Without this information, the operator does not have a documented and reliable method to enhance the completion.
Instead of using older technology that requires this waiting time and interferes with hydraulic fracturing, the operator deployed IMAGE Frac pressure-based fracture maps on several pads. This cost-effective technology offers a fast turnaround with proven, reliable results using only a surface pressure gauge. The fracture maps are field-proven in more than 2,500 hydraulic fracturing stages throughout the U.S.
The technology is based on a monitor well pressure gauge that records the poroelastic pressure response from a nearby treatment well that was hydraulically fractured. Using these data, Reveal Energy Services’ geoscientists and completion engineers compute the pressure-based map that quantifies fracture geometry for each treated stage. The map includes fracture half-length, height, asymmetry, and azimuth and how fast these dimensions grew. The map serves as a diagnostic tool that supports well objectives with relevant data in relevant time.
Informed, better decisions
The pressure-based fracture map allows an operator to optimize a stimulation treatment by continuously applying lessons learned from data collected and analyzed on every well. The map’s fracture geometry of half-length, height, azimuth and asymmetry determines whether the operator needs to change the treatment to match a development’s varying geology. Because of this geologic variability, the effect is that, in many cases, wells even very close to one another will produce vastly different amounts of oil and gas.
Previously, to overcome this nagging and often costly issue, an operator could validate the completion design using temperature and production logging, radioactive tracers, borehole imaging, tiltmeter mapping and microseismic monitoring. But all of this technology that characterizes and maps the fracture network is complicated, intrusive and expensive, significantly limiting an operator’s ability to update the completion on every well.
There is an opportunity for greater reservoir understanding. When an operator is working in an unconventional field, completing a well and draining the reservoir efficiently are the most important goals. By having a simple, accurate, affordable view of what’s happening downhole after a stimulation treatment at one-tenth the cost of the older methods, an operator can resolve the geologic variability issue by making informed, better decisions based on every well’s fracture geometry data and analysis.
With a rapid turnaround time of a few hours to a few days, the pressure-based fracture map can significantly shorten the wait time for completion design validation compared with the slower methods that can take up to six months. If the end goal is to ascertain how a few adjacent wells communicated during treatment, an electromagnetic tracer may be the best option. When an operator wants to evaluate the completion strategy for an entire field and determine if there is production consistency, the pressure-based fracture map is practical because of lower cost and the unintrusive footprint, enabling statistical data analytics across multiple projects.
Case study
The operator in the Eagle Ford designed a study that evaluated the effect of increasing the stage length to reduce completion cost. The goal was to determine if the new design would provide a similar fluid efficiency for more clusters per stage with similar fracture geometry per cluster.
The two designs were implemented on nine wells across two pads to eliminate any geologic variability with the results. Wells on these two pads alternated between the previous 61-m (200-ft) stage, six clusters per stage design and the new design with a 76.2-m (250-ft) stage and nine clusters per stage, as shown in Figure 1. The fluid and proppant volumes were adjusted to ensure the same fluid and proppant volume per cluster for both designs.

FIGURE 1. This illustration shows an Eagle Ford operator’s original and new design of a pad layout completion design. (Source: Reveal Energy Services)
A standard pressure gauge on the monitor well recorded during the zipper fracturing process the poroelastic pressure response generated by the newly created fractures in the treatment well. This simple, accurate and affordable data acquisition ensured the monitoring of a majority of stages without sacrificing zipper fracturing efficiency. Reveal Energy Services processed data from all nine wells to compute the fracture geometry, in addition to the fluid and cluster efficiency for each stage.
Figure 2 shows the results of the fracture halflengths for both pads. The plots show the fracture length for each design for every stage monitored. The results show that for a given pad the median fracture length was comparable for the 61-m and 76.2-m stage lengths. Both designs also showed comparable fluid and cluster efficiency.
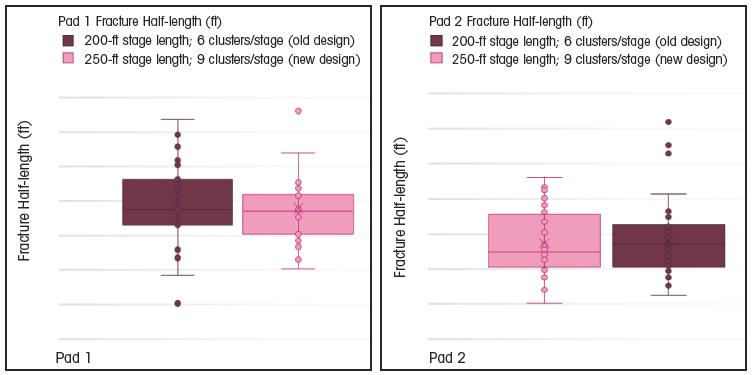
FIGURE 2. This illustration confirms that the new completion design with a 15-m (49-ft) longer stage length and three additional clusters per stage will achieve similar fracture geometry as the historical design. The new design will reduce completion costs by 20%. (Source: Reveal Energy Services)
The new design of 76.2-m stage length with nine clusters allowed the operator to decrease the number of stages by 20% per well, a significant cost saving on future pads.
Conclusion
A pressure-based fracture map with fracture geometry of half-length, height, asymmetry and azimuth serves as an accurate diagnostic tool to understand the effectiveness of a given completion design in producing the desired fracture geometry. With this information, operators can also conduct properly designed tests to rapidly determine the depth of the proppant within the fracture. It also allows operators to understand whether a diversion design is working and if the fluid is distributed equally between multiple clusters. All of these data are vital for an operator to make informed, better decisions that increase hydraulic fracturing efficiency to reduce the costs of future completions.
Recommended Reading

ONEOK CEO: ‘Huge Competitive Advantage’ to Upping Permian NGL Capacity
2024-03-27 - ONEOK is getting deeper into refined products and adding new crude pipelines through an $18.8 billion acquisition of Magellan Midstream. But the Tulsa company aims to capitalize on NGL output growth with expansion projects in the Permian and Rockies.
EQT Ups Stake in Appalachia Gas Gathering Assets for $205MM
2024-02-14 - EQT Corp. inked upstream and midstream M&A in the fourth quarter—and the Appalachia gas giant is looking to ink more deals this year.
EQT Deal to ‘Vertically Integrate’ Equitrans Faces Steep Challenges
2024-03-11 - EQT Corp. plans to acquire Equitrans Midstream with $5.5 billion equity, but will assume debt of $7.6 billion or more in the process, while likely facing intense regulatory scrutiny.

Ohio Oil, Appalachia Gas Plays Ripe for Consolidation
2024-04-09 - With buyers “starved” for top-tier natural gas assets, Appalachia could become a dealmaking hotspot in the coming years. Operators, analysts and investors are also closely watching what comes out of the ground in the Ohio Utica oil fairway.

US Proposes Second GoM Wind Lease Auction
2024-03-20 - Combined, the four proposed areas for offshore wind have the potential to power about 1.2 million homes if developed, according to the Interior Department.