Presented by:
![]()
Editor's note: This article appears in the new E&P newsletter. Subscribe to the E&P newsletter here.
Rock physics modeling is widely practiced as a fundamental component of quantitative interpretation studies. A rock physics model relates a rock’s reservoir properties to its elastic properties. Seismic waves propagating through rocks are directly influenced by their elastic properties. A rock physics model can therefore link well data measured in the borehole to seismic amplitudes measured at the surface.
What controls elastic properties?
The elastic properties of a rock are mainly controlled by its composition and texture. Rock composition depends on the type of minerals, porosity and fluids filling the pores. Elastic properties of pore fluids in turn are influenced by many factors such as fluid type and composition, saturation, distribution and phase. Rock texture is determined by the distribution and arrangement of minerals, the sorting of grains, contacts between the grains, cementation, and the shape of the pores. Rock texture, particularly sorting and cementation, is influenced by geological and diagenetic processes. In addition, elastic properties are affected by external factors including environmental conditions such as temperature, pressure and induced stresses, and the frequency of the propagating seismic waves.
How do geological processes influence elastic properties?
Clastic sedimentary rocks were formed by sediments from weathering and erosion of preexisting rocks that were subsequently transported by mechanical agents, either through river systems or wind-driven, and eventually deposited in various environments such as fluvial, deltaic, marine and eolian. Variations in rock texture are caused by many geological processes, such as different grain size due to the sorting process and grain angularity due to the abrasion process. After initial deposition, sediments are physically compacted causing a reduction in porosity and an increase in elastic properties. With increasing temperature, chemical processes occur that result in mineralogical changes, such as the transition of the clay mineral smectite to illite (Avseth et al., 2008). Cementation, a common diagenetic process, occurs where cements of various mineral types are precipitated into interstitial pore space, sometimes coating the grains. Cementation has a major impact on the formation of consolidated rocks and results in a significant increase in the elastic properties.
Which rock physics model should be used?
Many rock physics models have been published, from simple relationships interpreted through empirical observations to advanced theoretical models. Advanced models include effective medium models that relate elastic properties to reservoir properties with consideration of the composition and texture of the rocks, and hybrid models that are made up of a combination of two or more empirical and/or theoretical models. The hybrid models are typically based on rock physics workflows to handle different geological settings.
This study demonstrates that, when selecting the model in a rock physics modeling study, performing a rock physics diagnostics workflow is recommended to gain a good understanding of the geological environment and constraints. The dataset comes from the West Tryal Rocks of the North Carnarvon Basin offshore Australia and focuses on three hydrocarbon-bearing sandstones, namely M, N and O, from the Mungaroo Formation (Mathur, 2018).
Rock physics diagnostics as a prerequisite to rock physics modeling
Rock physics diagnostics allow us to investigate geological and diagenetic processes that control how a rock is formed and its elastic properties. These diagnostics involve the investigation of data from various scales, using a scanning electron microscope, thin sections, core, wireline logs and outcrop measurements, and then comparison with published rock physics models, and validation with a geological understanding of the rock, such as its sorting, cementation and roundness.
CGG GeoSoftware has implemented easy-to-use rock physics diagnostics tools in its RockSI rock physics program (Allo, 2019). A variety of rock physics templates with flexible parameter adjustment are available for users to perform rock physics diagnostics on a wide range of rock types found in various sedimentary environments.
Figure 1 shows an example of a petrographic interpretation based on photomicrographs of thin sections, which is subsequently used to complement rock physics diagnostics.
A number of observations can be made, such as the type of minerals and their distribution; grain characteristics, including degree of contact between grains and their angularity; the presence of cementation, including types of cement, volume of cementation and distribution of cements that have an impact on cement cohesion; and the volume of pores, their shape and distribution that significantly impact the rock’s elastic properties.
These observations can later be used as a reference to constrain the rock physics modeling parameters.
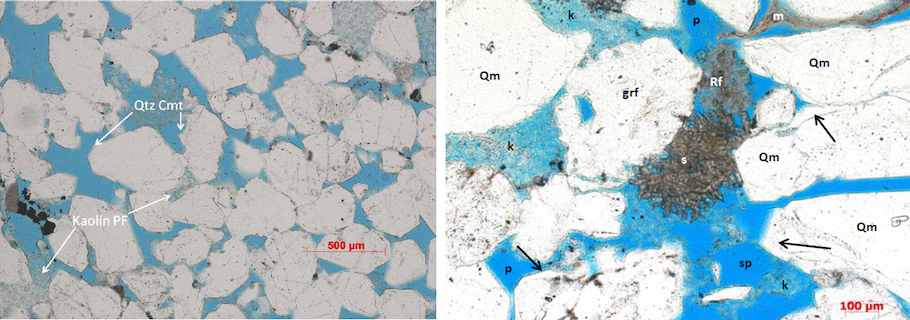
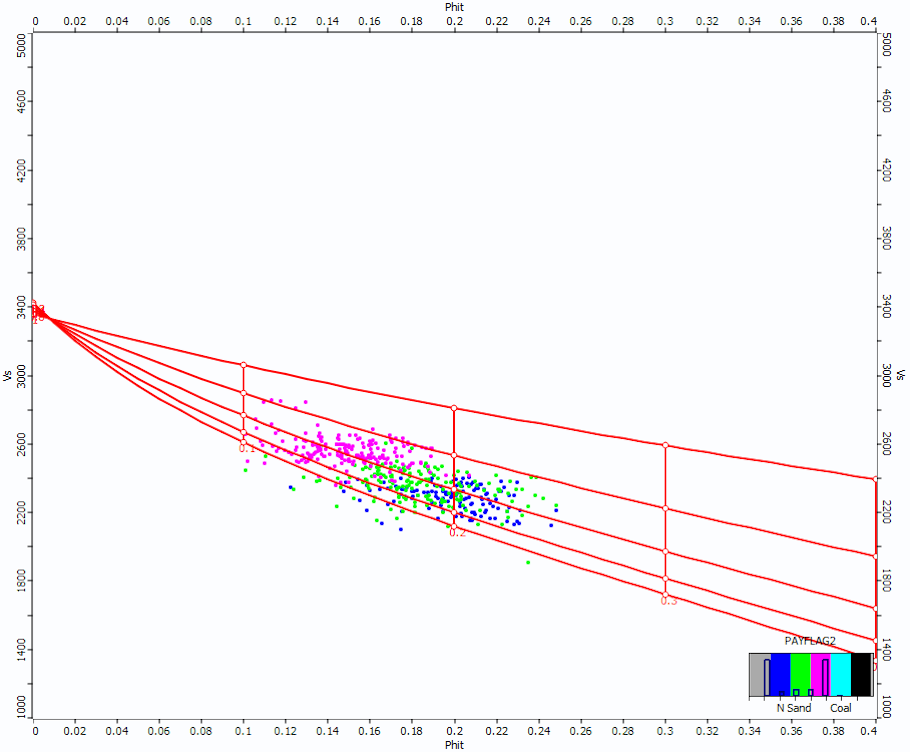
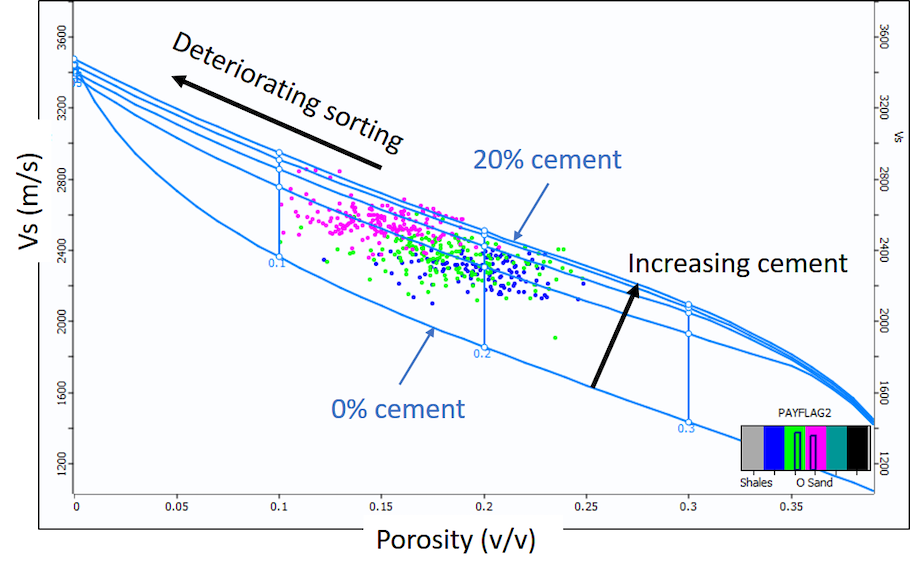
Figure 2 shows an example of rock physics diagnostics based on a porosity versus S-wave velocity crossplot. The three sandstones were overlain with a rock physics template from the Constant-Cement Model (Avseth, 2000). The observed cementation and sorting trends were comparable with the trends in the inset crossplot of porosity versus elastic modulus (after Avseth et al., 1999). Diagnostics from the crossplot for the three sandstones were consistent with observations from the geological study where the M sandstone is moderately well sorted; the N sandstone is poorly to moderately sorted; and the O sandstone is predominantly poorly sorted (after Mathur, 2018).
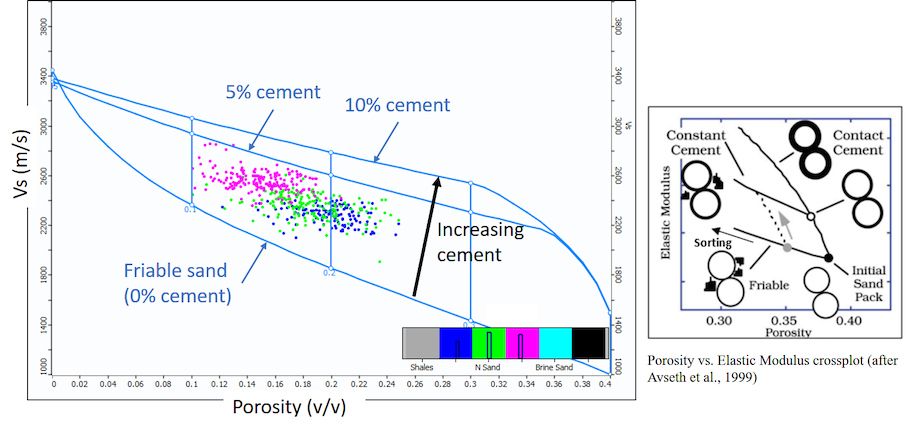
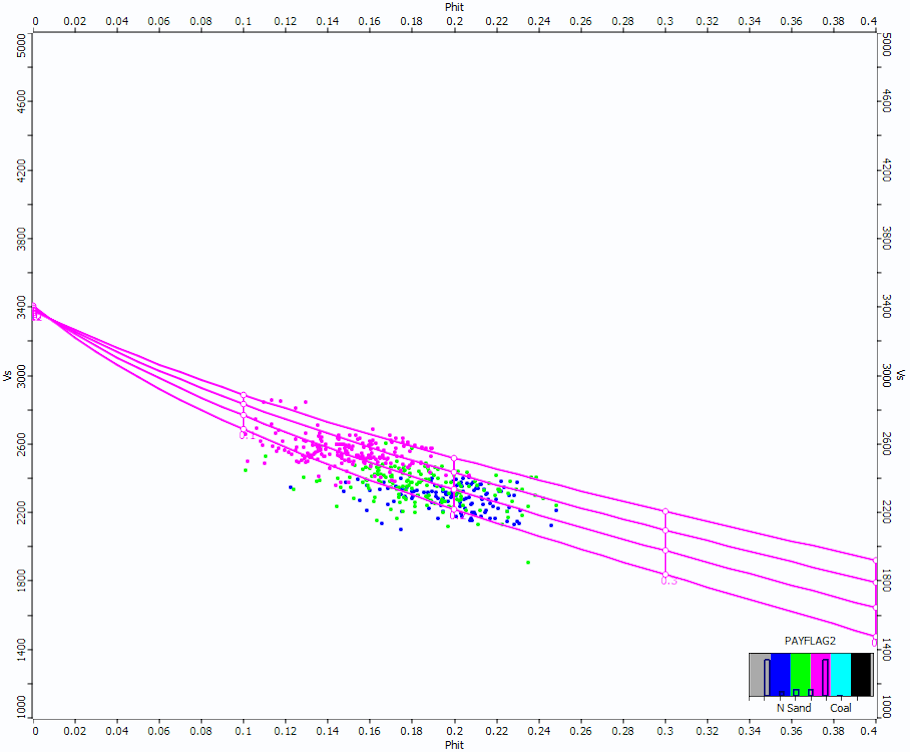
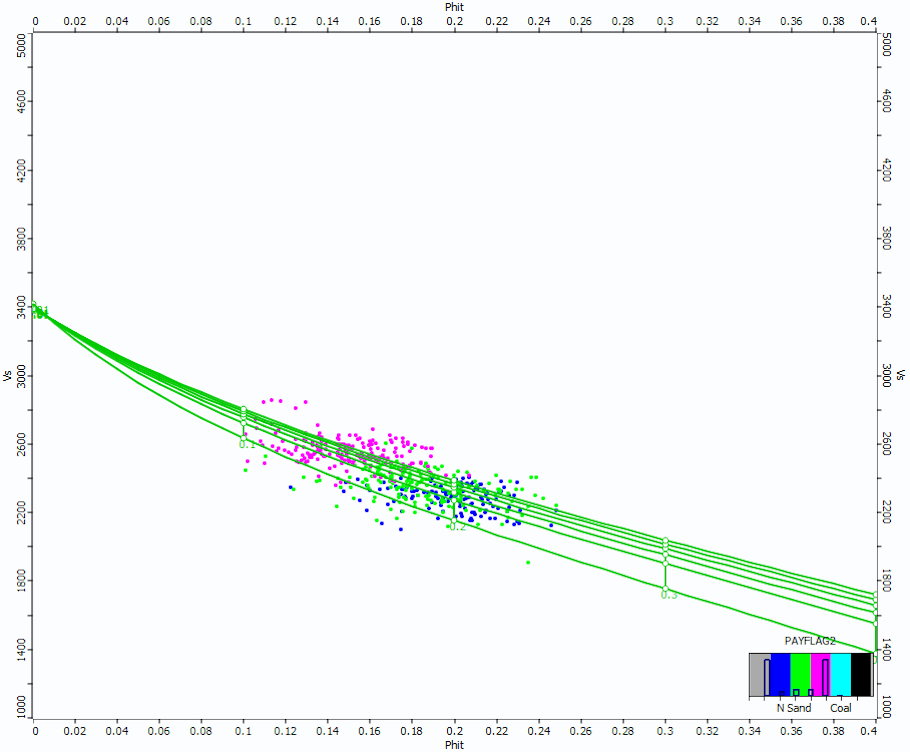
Figure 3 shows rock physics diagnostics for the M, N and O sandstones based on different rock textures, including coordination number, which is the average number of contacts per given grain, grain angularity and cement cohesion, which relates to the distribution of contact cement. These diagnostics are indicative of different geological parameters and can be used as starting points for rock physics modeling as well as sensitivity analysis to the modeling parameters.
Rock physics modeling of elastic properties with tailored geologic constraints
In the rock physics modeling step, all diagnostics performed earlier are used and the modeling parameters are set to meet geologic constraints and honor petrographic observations from core analysis, sedimentology and stratigraphic studies, fluid tests and analysis, and temperature and pressure data.
CGG's RockSI has a rich library of mineral and fluid properties as well as an extensive catalog of rock physics models for various geological scenarios. In addition, modeling can be performed per facies and/or per zone to handle very complex depositional settings independent of neighboring entities.
Based on rock physics diagnostics, the following rock textures were incorporated into rock physics modeling on sandstones M, N and O:
- Grain angularity: sub-angular to rounded in shape as shown in thin section images, where a grain angularity of 0.7 was used.
- Cement cohesion: thin section images indicate cement overgrowth on the grain surface but not at the grain contacts, so a cement cohesion factor of 0.6 was used.
- Cement volume: visual inspection of thin section images indicates that average cement volume is quite low; rock physics diagnostics indicate that average cement volume is about 4.5%, which is also confirmed by point count data (Table 1), so an average cement volume of 5% was used.
- Sorting trend: rock physics diagnostics indicate that sorting deteriorates from sandstone M to sandstone O, which is consistent with point count data (Table 1).
|
|
|
|
|
|
|
|
|
|
|
|
|
|
|
|
Table 1 displays grain sorting and quartz cement volume data for M, N and O sandstones.
The final rock physics model constructed for the three sandstones is shown in Figure 4.
Conclusion
This case study demonstrated a rock physics diagnostics workflow using three texturally different sandstones. The rock physics diagnostics were performed by honoring both petrographic observations and detailed rock texture analysis based on an understanding of geological processes such as deposition and diagenesis, with respect to available rock physics models. Understanding the geological constraints through rock physics diagnostics is critical to the selection of the most appropriate rock physics model for the study as well as in setting the modeling parameters.
References
Allo, F., 2019. Consolidating rock-physics classics: A practical take on granular effective medium models, The Leading Edge, 334-340.
Avseth, P., Dvorkin, J., Mavko, G. and Rykkje, J., 1999. Rock property diagnostics of North Sea sands: Link between microstructure and seismic properties.
Avseth, P., 2000. Combining rock physics and sedimentology for seismic reservoir characterization of North Sea turbidite systems. Ph.D. Thesis, Stanford University, USA.
Avseth, P., Dræge, A., van Wijngaarden, A.-J., Johansen, T.A. and Jørstad, A., 2008. Shale rock physics and implications for AVO analysis: A North Sea demonstration. The Leading Edge 27, 788–797.
Mathur, A., 2018, Geology constrained rock physics modeling, GEO India 2018, AU488.
RELATED CONTENT BY CGG:
Jan. 4, 2021: Process & Interpretation: Providing Crucial Data Visibility
Feb. 1, 2021: CGG’s GeoVerse Delivers Decades of Analytics-Ready Digitally Transformed Geoscience Data to Your Desktop
Nov. 2, 2020: CGG’s ResPack HD Becomes a Benchmark Seismic Inversion Technology for Optimizing Well Placement and Production
Recommended Reading

Range Resources Holds Production Steady in 1Q 2024
2024-04-24 - NGLs are providing a boost for Range Resources as the company waits for natural gas demand to rebound.

Hess Midstream Increases Class A Distribution
2024-04-24 - Hess Midstream has increased its quarterly distribution per Class A share by approximately 45% since the first quarter of 2021.

Baker Hughes Awarded Saudi Pipeline Technology Contract
2024-04-23 - Baker Hughes will supply centrifugal compressors for Saudi Arabia’s new pipeline system, which aims to increase gas distribution across the kingdom and reduce carbon emissions

PrairieSky Adds $6.4MM in Mannville Royalty Interests, Reduces Debt
2024-04-23 - PrairieSky Royalty said the acquisition was funded with excess earnings from the CA$83 million (US$60.75 million) generated from operations.
Equitrans Midstream Announces Quarterly Dividends
2024-04-23 - Equitrans' dividends will be paid on May 15 to all applicable ETRN shareholders of record at the close of business on May 7.