Presented by:
![]()
Editor's note: This article appears in the new E&P newsletter. Subscribe to the E&P newsletter here.
Exploration needs a geologic framework. Explorationists need new economical ways to identify and focus on sweetspots within the geologic framework of their exploration area of interest (AOI).
A lightning analysis is based on a new geophysical data type, lightning strike databases. Map and volume results can easily be integrated with other geological and geophysical control. This provides additional and independent dimensions of control and interpretation confirmation.
A lightning analysis uniquely enables economic exploration across a spectrum of exploration activities: aquifers, minerals, critical minerals, hydrates, coal bed methane, sweetspots in shale plays, hydrocarbon migration pathways, exploration for traditional oil and gas fields, and prediction of areas likely to have earthquakes or volcanic eruptions.
This article introduces a regional analysis of the transition out of the Bakken Shale on the eastern side of the Williston Basin in North Dakota.
Potential field data
Proven exploration processes include measurements of gravity, magnetic, electrical or electromagnetic (EM) fields. These potential fields obey the Laplace equation, a differential equation describing field behavior in free space. Potential field measurements are much less expensive than drilling wells to measure the subsurface and less expensive than common geophysical exploration techniques like 2D and 3D reflection seismology. Results from potential field data often have less resolution than seismic and are primarily used to provide an exploration framework.
Lightning is an EM phenomenon that has traditionally been considered random. Lightning strike data have been collected since the early 1980s. Insurance companies are the main user of these data, primarily to confirm lightning occurred in the vicinity of a damage claim. Television meteorologists use these data to show storm concentrations. Airports, golf courses and other public facilities use real-time versions of these data to enhance safety precautions.
In 2008 Dynamic Measurement LLC was formed to research and commercialize geophysical exploration services based on lightning strike databases. An exclusive license to the best lightning databases available has been supplemented with two issued U.S. patents and dozens of proof-of-concept projects. Publications, including two GCAGS Best Papers, have demonstrated the power of this new geophysical data type.
The static buildup in the atmosphere forming each lightning strike is random. As electrical charges build up in the cloud, the resulting electrical field interacts with subsurface telluric (earth current) fields. Lightning strikes last microseconds, and buildup occurs over tens of milliseconds. A 24-Hz signal, with a wavelength of 42 milliseconds, can have skin depths of 375 to 500 miles (600 to 800 km). This means lightning is interacting with geology down to the Mohorovičić Discontinuity.
Lightning is key to charging telluric currents used in magnetotelluric and Tipper exploration. Each lightning strike is a giant spark across a giant capacitor. This spark is guided along field lines by interaction between atmospheric and geologic EM fields. Knowing this, it is possible to create maps and volumes of lightning strike attributes and two derived rock properties (apparent resistivity and apparent permittivity), which help define subsurface geology and allow interpretation and creation of geologic frameworks.
Williston Basin project
When Dr. Dan Ebrom attended Dynamic’s Lightning Analysis Basics school, discussions turned to the Williston Basin and an old but new exploration idea.
As kerogens have thermally matured to become hydrocarbons in the tight Bakken Shale, geopressure has built up. Theoretically, this anomalous overpressure impacts seismic velocities, creating a velocity corona around the sweetspots. This article details Phase 1 of the work to see if lightning analysis can help identify these sweetspot coronas.
Typical projects start with a data order over the client AOI and paying Vaisala Inc., Dynamic’s lightning data vendor, for the lightning data. Dynamic has a regional set of test lightning data over the Williston Basin AOI, which had not been used to create volumes. This dataset includes 719,988 lightning strikes from the 10 years between March 28, 1999, to Nov. 6, 2008. Between two and 50 sensors recorded each lightning strike. A new data order over this same area would have about 2.2 times as many lightning strikes, or about 1.6 million strikes. This is important because the more data, the higher quality the results. The lightning analysis process is the reciprocal of 3D seismic. With lightning you have hundreds of thousands of sources and hundreds of receivers. The processing of these lightning data can be compared to “stacking” seismic traces, where signal is enhanced and noise is cancelled as data are merged.
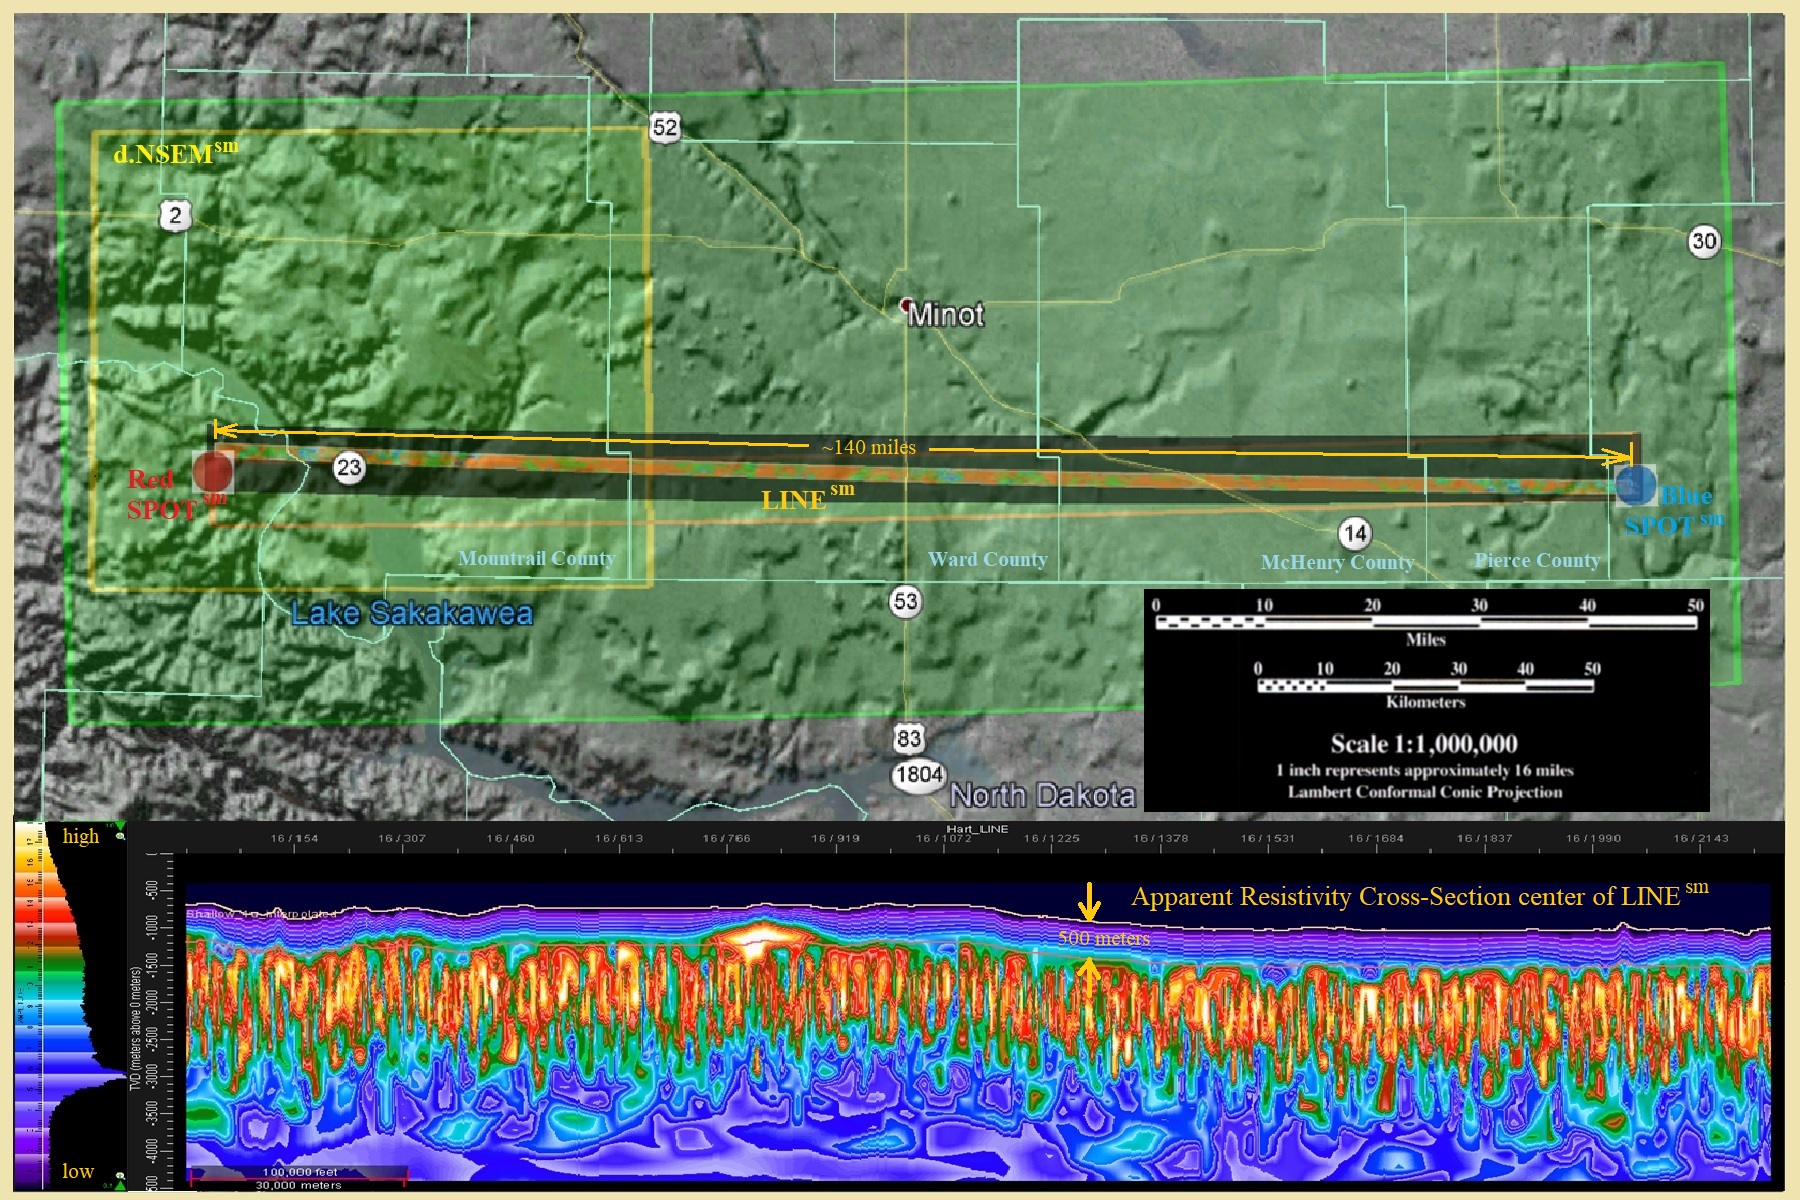
This Williston Basin project is based on creating four lightning analysis projects (Figure 1):
- The Red SPOT, a 6.675-km (4.12-mile) diameter project over the Antelope Field on the Nessen Anticline with 25-m (82-ft) trace spacing;
- The Blue SPOT, an equivalent project east of the Bakken Shale in Pierce County;
- The 224.1-km (139.25-mile) LINE project, 3.3 km (2.05 miles) wide with 100-m (328-ft) trace spacing, connecting the two SPOT surveys; and
- A d.NSEM project over the main part of the Nessen Anticline (85.15 km [52.91 miles] x 67.85 km [42.16 miles] with 50-m [164-ft] trace spacing).
Lightning processing and initial analysis
The first step in processing lightning data is to clean the data. The original data for each strike includes location; time and duration; rise time; peak current; peak to zero; polarity; chi-qquared (a quality measure); number of sensors recording strike; and semi-major and semi-minor axes of error ellipse.
Additional public domain data are added, including topography from the USGS, solar and lunar locations tied to earth tides, and other processes, which connect to the location and time of each lightning strike.
The 25 maps (ASCII, xyz, pdf or kmz formats) and 25 volumes (ASCII Voxel or SEG-Y formats) created for each of the four projects described above include: rise time; peak current (positive, negative and absolute); peak to zero; wavelet symmetry; wavelet total time; apparent permittivity; apparent resistivity; elevation; energy (positive, negative and absolute); stroke energy (positive, negative and absolute); frequency; chi-square; day of year; sun local longitude; moon local longitude; moon phase; number of sensors; tide; tidal gravity; tide gradient; and spike.
Landmark Graphics’ DecisionSpace enabled creation of numerous additional map and cross-section attributes. For example, the amplitude thickness of the top 500 m of each trace in the LINE volume is shown in the map on the top of Figure 1. These results tie surface anomalies on the shaded relief map. Phase, frequency, reflection strength, azimuth, dip, curvature, relief and numerous other trace attributes can also be calculated for each SEG-Y volume.
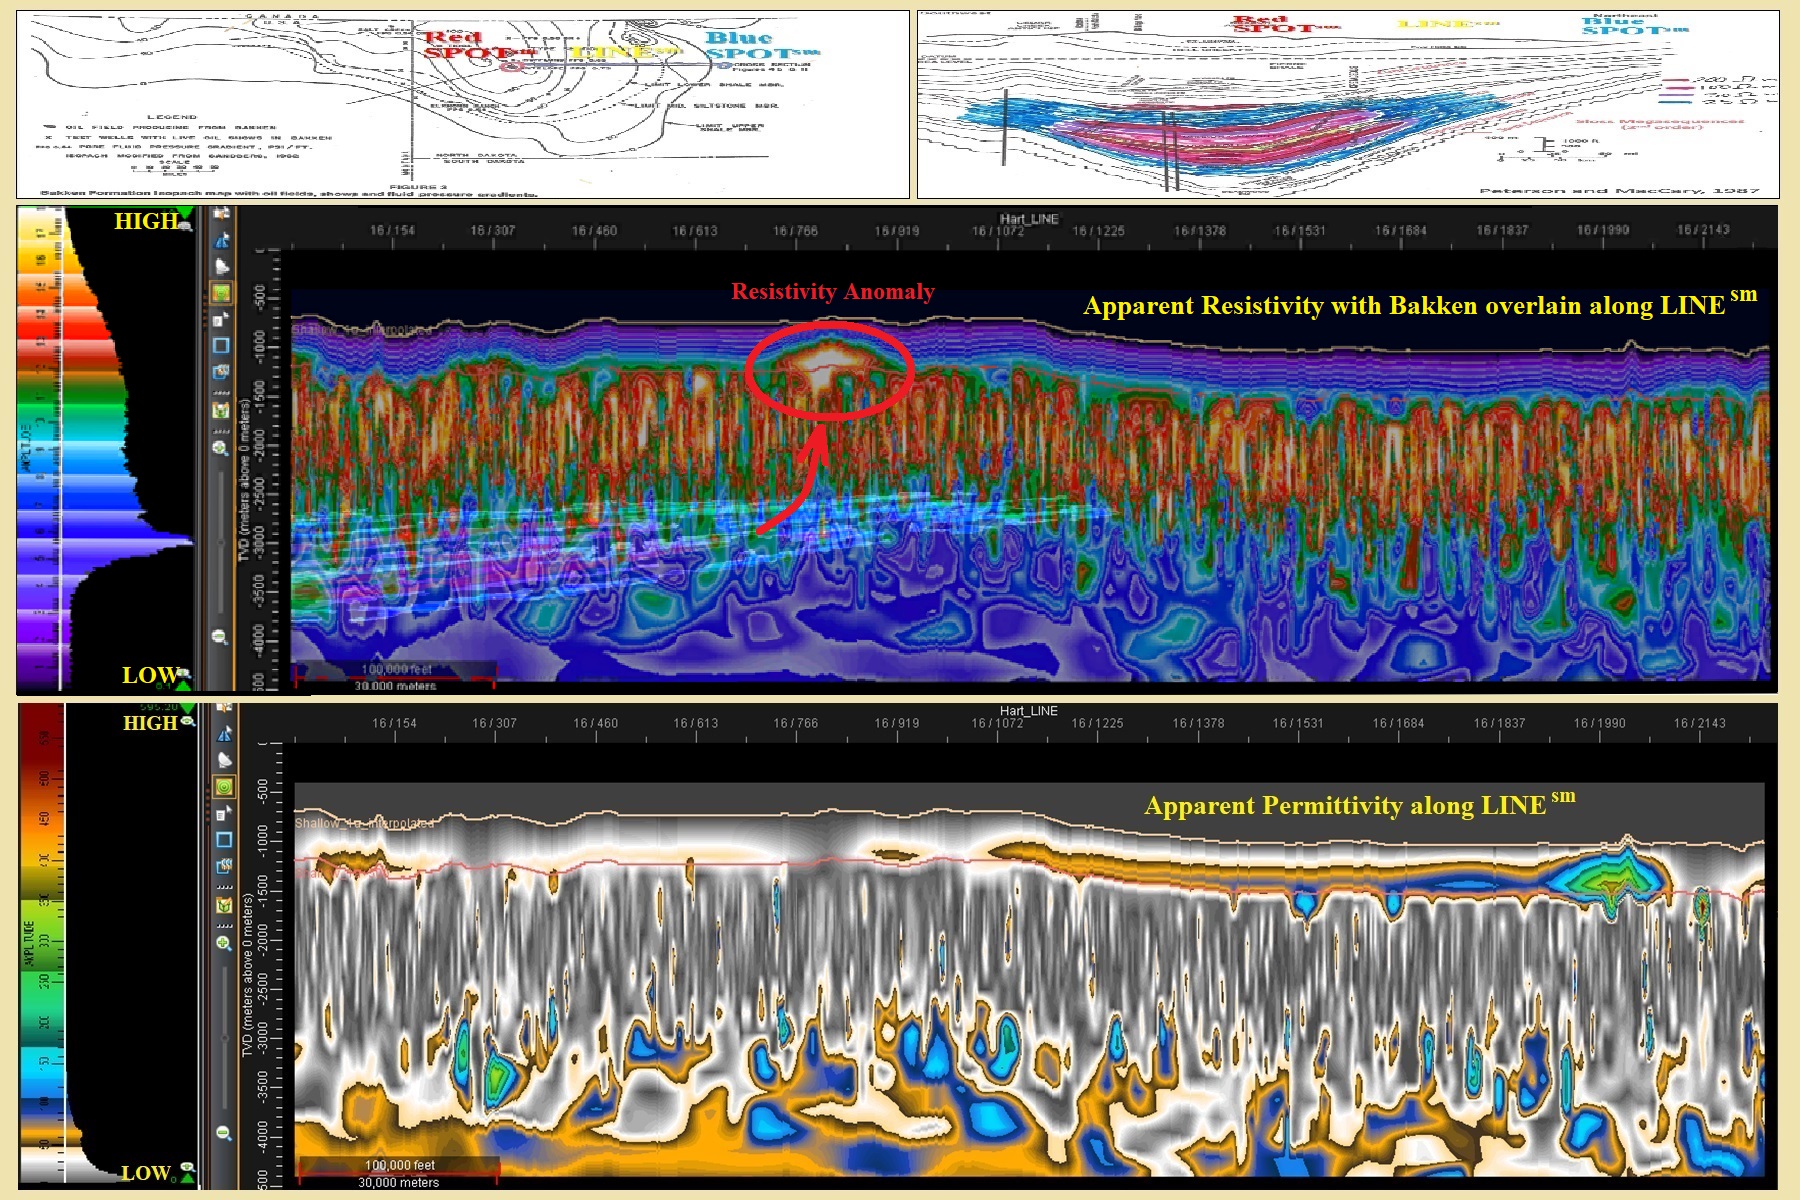
The instantaneous phase of the apparent resistivity volume shows dips that were helpful in calibrating against Meisner’s geologic cross-sections. The Meisner extent of the Bakken Shale is overlaid on the apparent resistivity top cross-section in Figure 2. The bottom cross-section is apparent permittivity. Note, the strong apparent resistivity anomaly above the pinchout of the Bakken Shale in both Figure 1 and Figure 2. It is logical this anomaly is related to hydrocarbon leakage from the updip pinchout of the Bakken Shale, possibly defining a new play in the basin.
There were too many displays generated for inclusion in this introductory article. However, an animated gif (see top of article) associated steps through examples of maps and volumes for each of the four projects described in this article.
Author's note: Building the project databases, as described herein, is a first phase of any interpretation project. The intention is to tie additional data (digital well logs, digital seismic sections and volumes, temperatures, pressures, production, etc.) into these projects for better calibration and better understanding of the strengths and weaknesses of lightning analysis as a geophysical framework tool. If you would like to participate in this effort, please contact Dan Ebrom at dan_ebrom@yahoo.com or (832) 274-8393, or contact Roice Nelson at roice@dynamicmeasurement.com or (713) 542-2207. We intend to publish the additional work.
References from article available upon request.
Recommended Reading

Thanks to New Technologies Group, CNX Records 16th Consecutive Quarter of FCF
2024-01-26 - Despite exiting Adams Fork Project, CNX Resources expects 2024 to yield even greater cash flow.

Cheniere Energy Declares Quarterly Cash Dividend, Distribution
2024-01-26 - Cheniere’s quarterly cash dividend is payable on Feb. 23 to shareholders of record by Feb. 6.

Marathon Petroleum Sets 2024 Capex at $1.25 Billion
2024-01-30 - Marathon Petroleum Corp. eyes standalone capex at $1.25 billion in 2024, down 10% compared to $1.4 billion in 2023 as it focuses on cost reduction and margin enhancement projects.

Humble Midstream II, Quantum Capital Form Partnership for Infrastructure Projects
2024-01-30 - Humble Midstream II Partners and Quantum Capital Group’s partnership will promote a focus on energy transition infrastructure.
Hess Corp. Boosts Bakken Output, Drilling Ahead of Chevron Merger
2024-01-31 - Hess Corp. increased its drilling activity and output from the Bakken play of North Dakota during the fourth quarter, the E&P reported in its latest earnings.