Presented by:
![]()
Editor's note: This article appears in the new E&P newsletter. Subscribe to the E&P newsletter here.
The unconventional oil and gas industry has made significant advances during the past two years in analyzing fracture-driven interactions (FDIs) using offset pressure data. FDIs are measured by changes in pressure in a monitor well(s) caused by fracturing activity in a nearby infill well. There are a variety of software tools available for operators to perform customized FDI analysis, including the FracEYE frac hit analysis service.
Now there is a growing interest in completion design analysis using distributed strain sensing (DSS) measurements. An approach similar to identifying FDI events can be applied to strain data to identify fracture-driven strain interactions (FDSIs) to better understand interwell connectivity. But the FDSI analysis can only be done by a fiber-optics vendor that has its own proprietary analytics method. Operators are resorting to herculean measures to integrate FDSI with treatment data, additional diagnostic data and geologic data due to the lack of a vendor-neutral platform to perform such analysis.
With this in mind, the Reveal Energy Services R&D team envisioned another way, one that was simple, affordable and accurate. The team relied on the company’s expertise, beginning in 2016, of acquiring pressure data from more than 30,000 U.S. and Canada hydraulic fracturing stages using a surface pressure gauge, combined with the teams’ deep professional knowledge of integrated diagnostic analyses. Those experiences enabled the team to develop a vendor-neutral diagnostics platform in less than six months during 2020, a process that would have taken at least two to three years if not based on real-world experience.
The vendor-neutral ORCHID completions evaluation platform eliminates the unconventional oilfield data management headaches to support integrated completions evaluation, including FDI and FDSI analysis. The platform integrates real-time treatment data with DTS, DAS, DSS, pressure, microseismic and other data to optimize unconventional reservoir development strategy.
Diagnostics data integration challenges
Let’s look at why integrated diagnostics and, in particular, the integration of fiber data are so challenging.
There is no formal or de facto standard data format used by the myriad diagnostics vendors and service companies. For example, fiber data can be delivered in CSV, ASCII, HDF5 or LAS format. Therefore, most vendors have resorted to developing and supporting their own standards to share their results with customers. This scenario does not satisfy operators that need to unify all acquired diagnostics data to perform rigorous analysis.
The challenges compound beyond data standards. Time-zone, geodetic references, and MD and TVD references across vendors may be also misaligned. Moreover, inconsistency in units can lead to a lot of errors. For something as simple as volume, an operator can expect to see bbl, ft3, gallons and perhaps m3 being used in a single project.

The adoption of services from one vendor requires understanding the specific set of software and analysis functionality, which are unlike other vendors’ applications. Table 1 summarizes the current practice for integrated fiber data interpretation. The software and analysis functionality very often do not align horizontally or vertically across distributed fiber-optic sensing vendors, let alone align with vendors that have differing technologies, such as microseismic, pressure and tracers. Each vendor has a specific way of interacting with and analyzing the data, usually with proprietary algorithms that are opaque to the end user. Under these circumstances, an operator is often forced to:
- Adopt a single vendor-source strategy as much as possible;
- Handle the multiplicity of software user interfaces and configurations from each vendor; or
- Cope with feature gaps and limitations.
All of this limits operators’ ability to undertake integrated interpretation of their acquired diagnostic and completion data in a timely manner. Realizing the full data value is restricted by this frustrating integration dynamic.
Constructing a workflow for FDSI analysis
So what does an FDSI analysis look like? Figure 1 shows the basic steps for this workflow, starting with data loading followed by data cleansing and QC, making the data analysis-ready. These primary data include the well geometries, completion data, offset fiber data and all additional diagnostics data that one would like to consider. The third step is data fusion in which secondary or derivative data are generated.
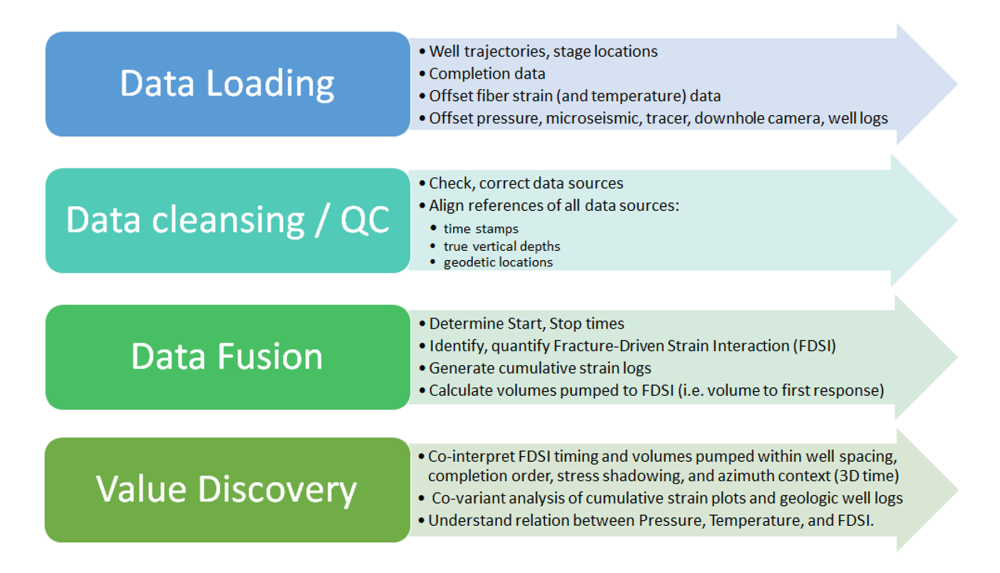
ORCHID has automated many data fusion functions (e.g., calculations for interwell distances, pumped volumes, first and second derivatives, and stage completion start/stop times). In the final step, Value Discovery, everything comes together for the rigorous statistical analysis and co-interpretation to deliver key insights.
For FDSI analysis, a guided workflow is available for picking FDSI events.
User-friendly app architecture
User-friendly app architecture is a core ORCHID strategy, enabling greater flexibility in customizing the look, feel and functionality of the user interface. ORCHID is a powerful tool for assembling disjointed data into highly structured and interpreted projects that can serve as key inputs to increase stimulation effectiveness, well spacing and reservoir development strategy. Structured data, which can be digitally captured in real time, minimize workflow variations. Standardizing and aggregating data from divergent sources are easy, creating a flexible way to draw on the structured information for workflow improvement.
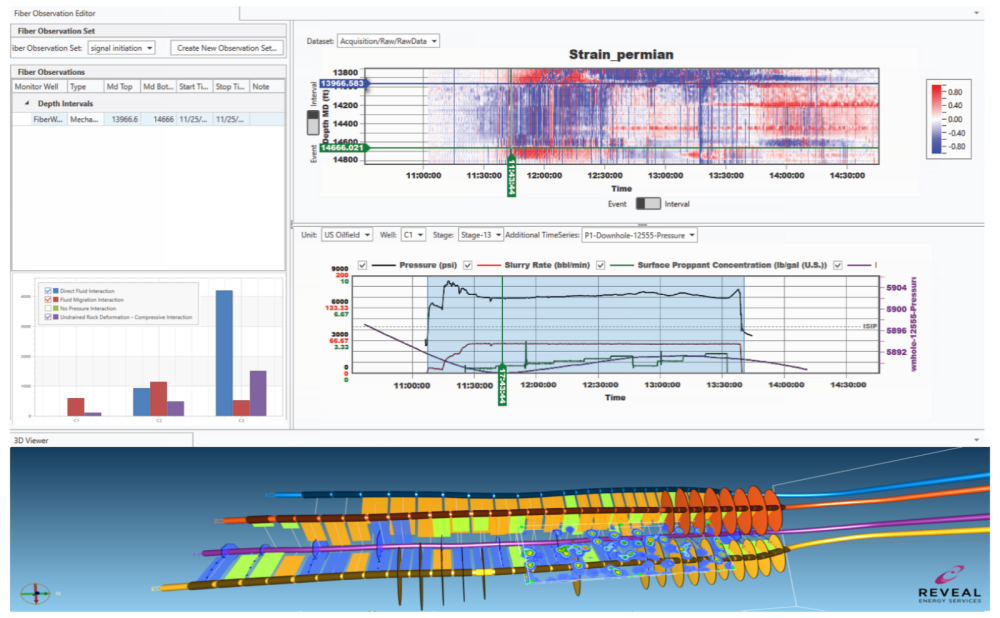
Figure 2 shows an example of how to easily perform co-interpretation of FDSI and FDI analysis on loaded DSS and offset pressure data. The engineer selects the appropriate depth range to analyze before picking the exact time when the strain response first appears on the offset well. The engineer then cross-validates this strain response with the offset pressure data. In this example, Reveal sees a very good match between the start of the strain response and the start of the offset pressure data increase although that is not always the case.
While performing this co-interpretation, the engineer can also observe the individual infill well treatment data to better understand the impact of changes in slurry rate, treatment pressure and proppant concentration on the FDSI and FDI responses observed in the monitor well. This functionality speeds the co-interpretation of the multiple diagnostic datasets and also enables flexibility in evaluating the intrawell communications and completion effectiveness.
Conclusion
The ORCHID completions evaluation platform:
- Eliminates confusing UIs for one clean, intuitive interface;
- Avoids vendor lock-in;
- Drives collaboration across the enterprise through smart, uniform workflows with quality and interpretation tasks in one place;
- Measures and improves quality through best-practice workflows (e.g., FDSI and FDI analysis, ISIP, volume-to-response, and custom workflows) that meet an operator’s needs; and
- Improves efficiency by contributing to quicker turnaround times for integrated analysis.
The platform offers engineers a better understanding of what is happening in these wells, permitting data-driven changes or adjustments to operational plans that optimize unconventional reservoir development strategy and long-term production potential.
Recommended Reading
US Drillers Add Oil, Gas Rigs for First Time in Five Weeks
2024-04-19 - The oil and gas rig count, an early indicator of future output, rose by two to 619 in the week to April 19.
Strike Energy Updates 3D Seismic Acquisition in Perth Basin
2024-04-19 - Strike Energy completed its 3D seismic acquisition of Ocean Hill on schedule and under budget, the company said.

Santos’ Pikka Phase 1 in Alaska to Deliver First Oil by 2026
2024-04-18 - Australia's Santos expects first oil to flow from the 80,000 bbl/d Pikka Phase 1 project in Alaska by 2026, diversifying Santos' portfolio and reducing geographic concentration risk.
Iraq to Seek Bids for Oil, Gas Contracts April 27
2024-04-18 - Iraq will auction 30 new oil and gas projects in two licensing rounds distributed across the country.
Vår Energi Hits Oil with Ringhorne North
2024-04-17 - Vår Energi’s North Sea discovery de-risks drilling prospects in the area and could be tied back to Balder area infrastructure.