Presented by:
![]()
Editor's note: This article appears in the new E&P newsletter. Subscribe to the E&P newsletter here.
Effective and safe hydraulic fracture completions are crucial to maximizing the profitability of horizontal wells. To enable engineers to continue to optimize well treatment designs, diagnostic data tied to production is crucial. A recent project at a shale well in East Texas showed the benefits of employing fiber-optic sensing during production monitoring.
Shale wells have evolved in recent years with increasing lateral lengths and decreasing cluster spacing. Quickly finding the ideal lateral length and perf cluster design for the economic conditions requires a diagnostic tool that can tie those design changes back to production in near-real time. The questions remain, though, how close is too close and does decreasing cluster spacing to a certain length improve well profitability and add to EUR, or does it create potential challenges?
These design optimization trends have driven a demand for a diagnostic tool that can simultaneously measure all events happening along the entire wellbore, with little interference to the true production flow regime during in-flow, while also maintaining high spatial resolution down to the cluster level. Fiber-optic sensing technology can do both providing new data that are being used by operators to take their fracture stimulation designs to the next level.
Fibre optics for oil and gas
Developed for data telecommunications, fiber-optics technology transitioned to also include sensing applications in the 1970s. Over the past decades increased sensing distances and higher spatial resolution have increased fiber optic’s applications. Simultaneous measurements of acoustic fields (DAS – distributed acoustic sensing), strain (DSS - distributed strain sensing) and temperature (DTS - distributed temperature sensing) along the horizontal distance of the fiber can now be made instantaneously at the speed of light.
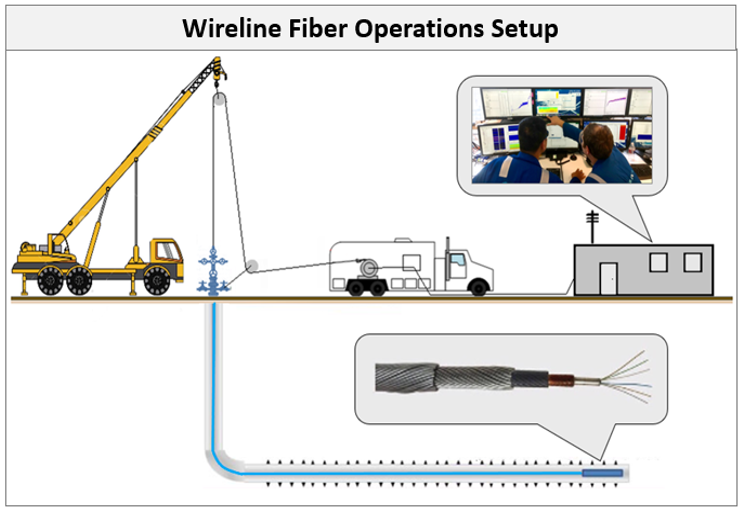
Fiber has traditionally been permanently installed by clamping and cementing in place a fiber cable outside the casing, but improvements in the fiber acquisition system signal-to-noise ratio (SNR) increased the installation options available. An engineered fiber with 100x improvement in SNR over standard fibers can now be placed inside a wireline cable that can be deployed inside the casing to acquire data and then subsequently be retrieved to be used on additional wells.
As fiber data are a distributed measurement, at every meter along the optical fiber acoustic, strain and temperature data can be acquired. Silixa's Carina 100Xlog is a retrievable fiber-optic well logging service that visualizes entire well dynamics in real time much more rapidly than conventional technologies, reducing deferred production.
Testing times in East Texas
To demonstrate the capability of the technology, a production monitoring project was planned at a well in East Texas targeting the Haynesville Shale. The target formation in this area is located at approximately 11,000 true vertical depth, making it a high-temperature (300-plus F) and high-pressure dominantly dry gas producing reservoir. A well was chosen for production monitoring within the operator’s large acreage position in East Texas so the findings from the project could be applied across their 44-plus horizontal well completions per year.
Before the project began, the well had been producing for a month after having been fracture stimulated. Previously, the well had been fracture stimulated with 99 stages. The identical design of stages 1 to 74 all contained six clusters, at six shots per foot, with an average cluster spacing of 17 ft. The design of stages 75 to 99 included variations of increased clusters counts, decreased cluster spacing, reduced number of shots per foot and tapered perf designs.
A coiled tubing clean-out operation was performed before logging the well to increase the chances of reaching the toe without experiencing increased friction caused by solid materials and well tortuosity along the wellbore. A high-temperature tractor was chosen to pull the wireline fiber to the toe. The tractor was ultimately able to pull the wireline fiber to a total depth of approximately 20,700 ft, allowing production to be measured from all but the first six stages of the 99-stage wellbore. The plan was to produce the well for 60 hours at variable rates. Four opening and closing sequences were chosen to capture any production changes.
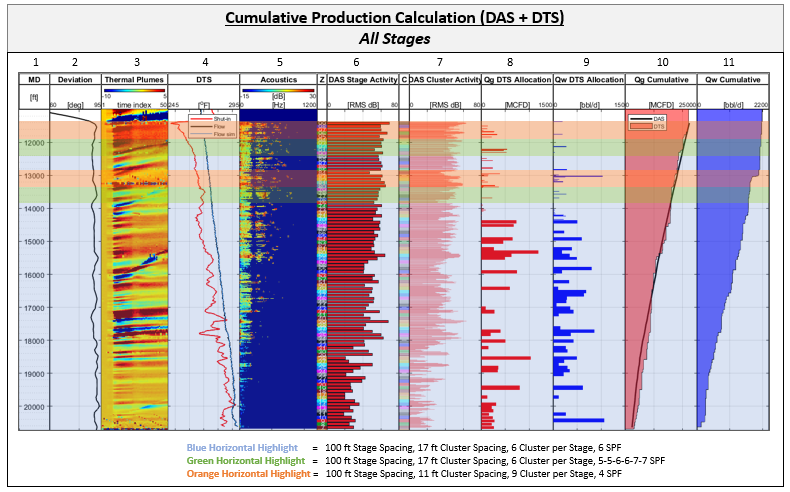
The data processing workflow for multiphase allocation combines DAS derivates, such as acoustics spectral noise logging, sound speed analysis and thermal plumes analysis, to constrain an enthalpy balance based thermal model. The thermal model takes into consideration essential well information including a well diagram, fluid properties, deviation survey, surface rates and other reservoir information that can help reduce the uncertainty of the model.
The main takeaway from the production analysis is the increase in production for the stages that contained the reduced cluster spacing. The nine-cluster design with reduced cluster spacing of 11 ft produced 140% more at a 100% choke setting than the six-cluster design with 17-ft cluster spacing, even though the stage length and the amount of fluid and proppant pumped were equivalent. Uncertainty remains whether the downspaced cluster spacing is accelerating production and/or adding to EUR as these data were acquired early in the life of the well when the fracture-reservoir flow regime may not have reached boundary flow conditions.
Positive results
An extremely positive 140% to 175% production uplift was observed from the nine-cluster design compared to the six-cluster designs at various choke settings by the wireline fiber-optic cable.
Another fiber production log can offer insight. Production along the lateral is heel-dominated with toe-stages 1 to 34 contributing only 15% to total production, even though those stages cover 34% of the lateral length. Water slugs are observed starting at the most extreme sump located approximately halfway down the lateral. The positive insight gained from this diagnostic job will be used to optimize future designs to right-size the completion to the economic environment.
Recommended Reading
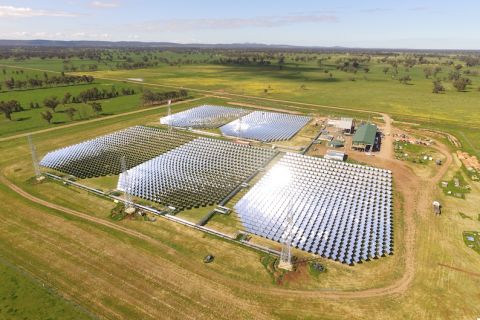
Could Concentrated Solar Power Be an Energy Storage Gamechanger?
2024-03-27 - Vast Energy CEO Craig Wood shares insight on concentrated solar power and its role in energy storage and green fuels.

CERAWeek: NextEra CEO: Growing Power Demand Opportunity for Renewables
2024-03-19 - Natural gas still has a role to play, according to NextEra Energy CEO John Ketchum.

US Geothermal Sector Gears Up for Commercial Liftoff
2024-04-17 - Experts from the U.S. Department of Energy discuss geothermal energy’s potential following the release of the liftoff report.

Scout Signs Agreement with AdventHealth for Texas Wind Farm
2024-02-01 - Scout Clean Energy will supply a portion of its Heart of Texas wind farm to support 40% of AdventHealth’s electricity needs.
Energy Transition in Motion (Week of Feb. 16, 2024)
2024-02-16 - Here is a look at some of this week’s renewable energy news, including the outlook for solar and battery storage in the U.S.