Presented by:
![]()
This article appears in the E&P newsletter. Subscribe to the E&P newsletter here.
The upstream oil and gas industry has seen its share of innovation over the past several decades. The driving force behind these changes has always been a relentless push toward operational and capital efficiency. With this in mind, the patented sealed wellbore pressure monitoring (SWPM) process was born. Developed by a team of completion engineers at Devon Energy, SWPM was commercialized in 2020 by Devon’s exclusive partner Well Data Labs. Since then, over 10,000 stages have been analyzed with SWPM in every major North and South American unconventional basin.
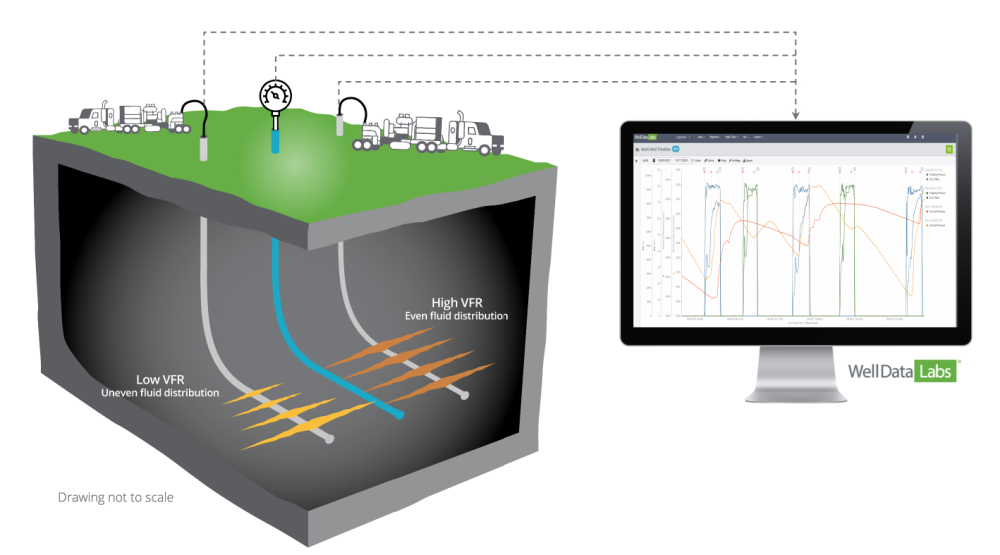
The concept behind the SWPM technique is straightforward, economical and highly accurate. A sealed wellbore filled with low compressibility fluid, typically freshwater or brine, acts as a monitor well. Surface or downhole gauges on the monitor well measure minute pressure changes, which provides valuable data. As a nearby active well is hydraulically stimulated, fractures spread toward the sealed wellbore. When fractures interact with the sealed wellbore, the gauges respond to the pressure changes. This pressure data is collected and transmitted, along with the fracturing data, to the Well Data Labs cloud-based system, which is used to analyze fracture-driven interactions between the active and monitor wells (Figure 1).
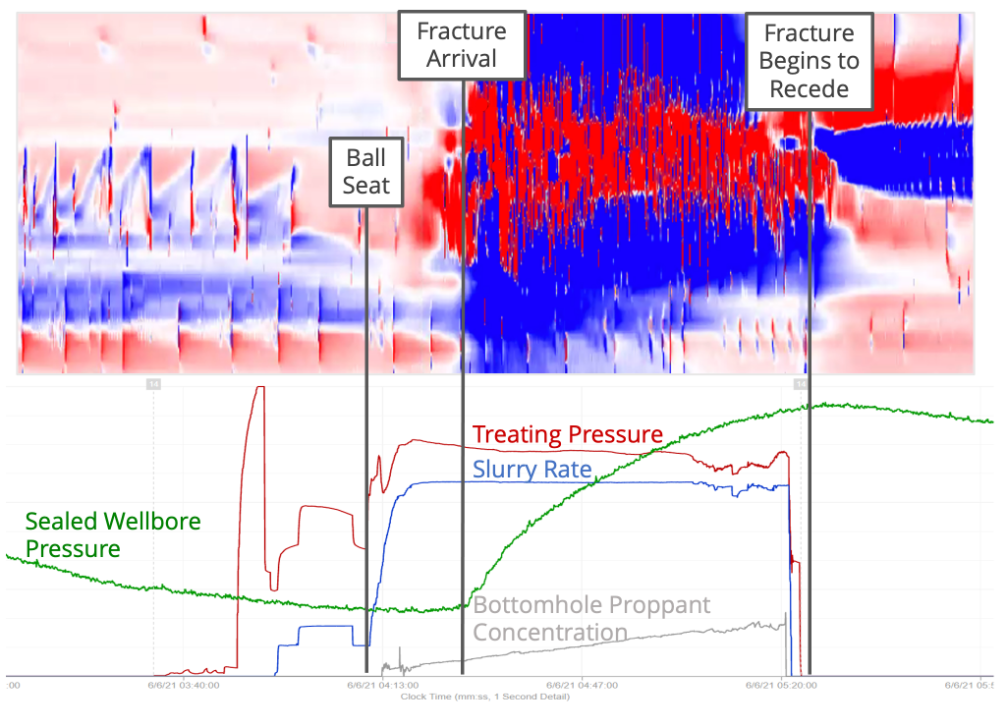
SWPM, a 2021 Hart Meritorious Engineering Award recipient, has proven to be a tremendously valuable, flexible tool for the oil field and has also been validated by other oilfield diagnostics. A recent case study from the Permian Basin provides a visualization of fracture arrivals detected via a cross-well strain, an established diagnostic tool, versus the pressure responses observed in the monitor well (Figure 2).
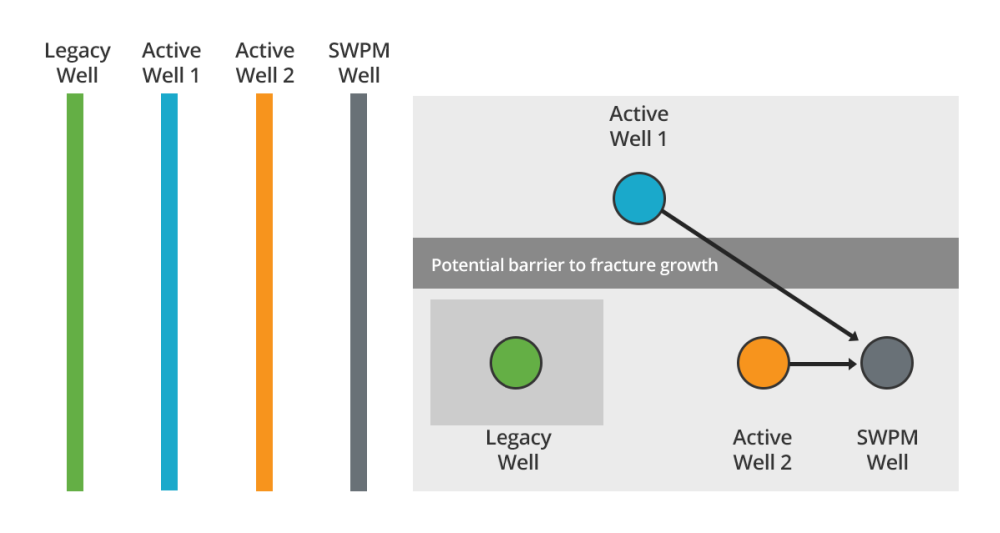
A primary measurement from SWPM is volume to first response (VFR). VFR is the amount of frac fluid pumped in the active well when the first pressure response is observed in the monitor well. As is often the case, legacy wells can contribute to depletion on a pad. When there is no depletion from nearby wells, the VFR can be a proxy for cluster efficiency and used to estimate the fracture geometry. If depletion is present, it can skew results. The region of pressure depletion around the legacy well reduces stress which can “pull” fractures toward the legacy well causing a delayed response in the monitor well (Figure 3).

Permian Case Study
An operator in the Permian had two objectives for its initial SWPM project. First, it sought to better understand the impact of legacy well depletion on fracture growth within the lower interval. Additionally, the operator wanted to confirm if the shale layer between the upper and lower intervals was a barrier to fracture growth. (Figure 4)
The operator and its service companies worked with Well Data Labs to ensure timely, accurate collection of relevant active well data. The data was analyzed by Well Data Labs using its proprietary algorithms and machine learning techniques. A high-level summary of the project results is shown in Figure 5.
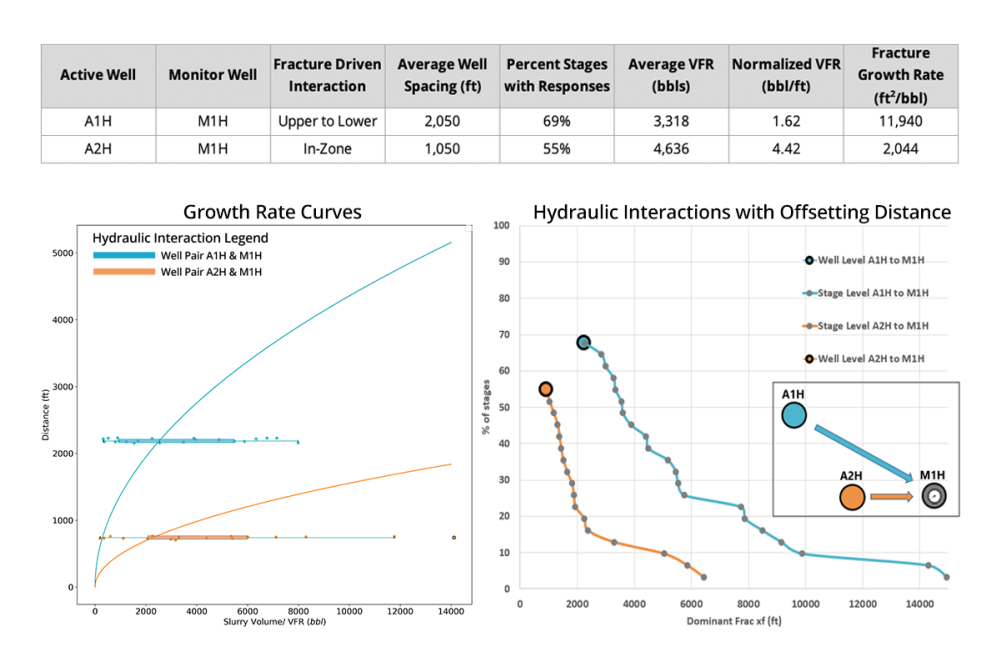
The two active wells were treated with the same number of stages and identical frac designs. The initial conclusion confirmed the shale layer was not a barrier to downward fracture growth. The lower-left plot in Figure 5 shows the median fracture growth rates, where the leading edge of the fracture can be estimated using the response distance and volume and assuming a square root of volume relationship to xf, for the two well pairs. The box plots show the statistical variation of the individual VFRs and demonstrate that there were more responses between the upper and lower zone pair than there were for the in-zone well pair. The upper-to-lower formation well pair (blue curve) had a lower average VFR and normalized average VFR. This suggests that the fracture growth rate was greater in the downward direction, even when accounting for different active well distances to the monitor well, compared to when the fractures moved in-zone.
Fracture half-lengths can offer insight into the presence of depletion on a pad. To do this, we estimate fracture half-lengths using the fracture growth rates for the individual frac stages. From here, we can create a plot to compare these by stage. (Figure 5, lower right). This plot correlates fracture arrivals at a certain distance from an active well and provides insight into the extent the region was stimulated. Referencing the second active well (Figure 5, orange curve), the results suggest that half of the stages created a fracture length that was approximately the same as the average well spacing between the in-zone treatment well and the monitor well. Although depletion by the legacy well likely caused asymmetric fracture growth to the west, the team concluded that the frac size was sufficient to stimulate the region between the active and monitor well.
In summary, applying SWPM provided a simple, economical, and robust way to quantify the depletion impact and confirm the shale layer was not a barrier to fracture growth. The SWPM technique allows for case studies like these to be scaled up quickly and opens the door to cost-effective and meaningful real-time completions diagnostics.
Recommended Reading

SLB’s ChampionX Acquisition Key to Production Recovery Market
2024-04-19 - During a quarterly earnings call, SLB CEO Olivier Le Peuch highlighted the production recovery market as a key part of the company’s growth strategy.

PHX Minerals’ Borrowing Base Reaffirmed
2024-04-19 - PHX Minerals said the company’s credit facility was extended through Sept. 1, 2028.

BP Restructures, Reduces Executive Team to 10
2024-04-18 - BP said the organizational changes will reduce duplication and reporting line complexity.

Matador Resources Announces Quarterly Cash Dividend
2024-04-18 - Matador Resources’ dividend is payable on June 7 to shareholders of record by May 17.

EQT Declares Quarterly Dividend
2024-04-18 - EQT Corp.’s dividend is payable June 1 to shareholders of record by May 8.