(Source: Hart Energy)
[Editor's note: This story originally appeared in the January 2020 edition of E&P. The article below is an extended version with additional charts from Rystad Energy. Subscribe to E&P magazine here.]
A Rystad Energy analysis has found little evidence that lower crush strength proppants appreciably change production decline curves in the Midland Basin. Yet in the Delaware Basin, brown sand appears to increase the decline rate when analyzing operators in aggregate.
Proppant is required to withstand high temperatures and pressures downhole to allow hydrocarbons to flow to the wellbore. Proppant had sometimes been made of synthetic ceramics, but operators have determined this is rarely worth the cost. Historically, operators believed that only Northern white sand, mined in Wisconsin and neighboring states, fits the strength and shape requirements for most shale wells. However, brown sand mines in Central Texas have long served frac sand to the Permian Basin even before 2014. The downturn forced operators to cut costs and, as a result, brown sand volumes increased in 2015 and 2016. In late 2017, in-basin sand mines began to come online in the Permian, cannibalizing demand for Northern white sand and imported brown sand.
In recent years, operators have pumped an increasing amount of proppant per stimulated foot, while simultaneously lengthening laterals. To mitigate the resultant costs and logistical difficulties, operators and service companies alike have switched to lower cost in-basin sands. Yet concerns remain whether the new design profile of wells—which require massive amounts of lower crush strength sand—will result in steeper production decline.
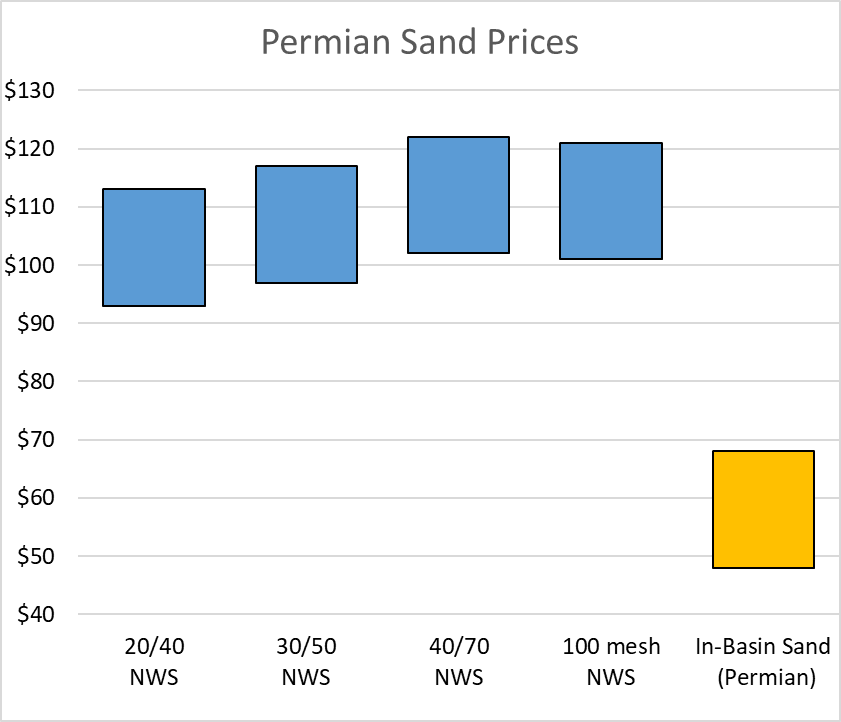
In-basin sand adoption in the Permian is at approximately 80%, which is among the highest of all plays in the U.S. The Delaware has deeper formations with higher downhole pressures, whereas the Midland has shallower formations with lower downhole pressures. In-basin sand adoption on the Midland side of the Permian Basin has historically been higher relative to the Delaware due to this very reason. There are about 20 active in-basin sand mines serving the Permian.
Methods
When analyzing a well’s performance with available data, the most important factors to consider are the well’s location, operator and completion date as well as the mass of the proppant used and lateral length. Different acreage locations have different production potential; therefore, the effects of proppant will differ. Operators will apply varying techniques, which may have a significant effect on production but will not appear in publically available data. Similarly, completion techniques change over time; thus, models must keep the completion date of analyzed wells in mind.
The total amount of proppant and the length of laterals will both increase production. These are mathematically simple to control, and many linear models find that controlling for one eliminates the need to control for the other. Lateral length can thus be controlled by dividing production by lateral length. Because well production rises slightly less than linearly with lateral length, this method is not perfect, but it should hold when examining small groups of wells with roughly similar lateral lengths.
Data on the sand type used are sourced from self-reported numbers in the FracFocus Chemical Disclosure Registry. Coverage is not complete, and there is some bias for wells where Rystad does not know which sand type has been used. Rystad also has made an effort to fill in data gaps by utilizing other sources when possible.
Midland Basin results
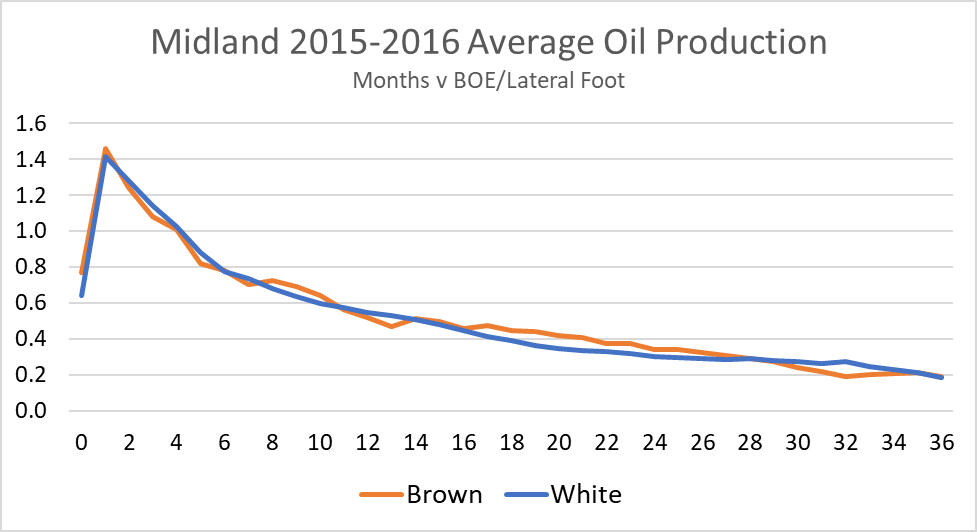
In previous studies, Rystad Energy did not find a statistical relationship between production decline in the Midland and the type of sand used. As seen in Figure 2, initial results show that for 2015 and 2016 horizontal wells, brown sand had little effect on well curves in the Midland Basin.
Rystad identified 68 brown sand fracs and 126 white sand fracs operated by Operator A in 2016 and 262 wells operated in the same region by other operators in 2016.
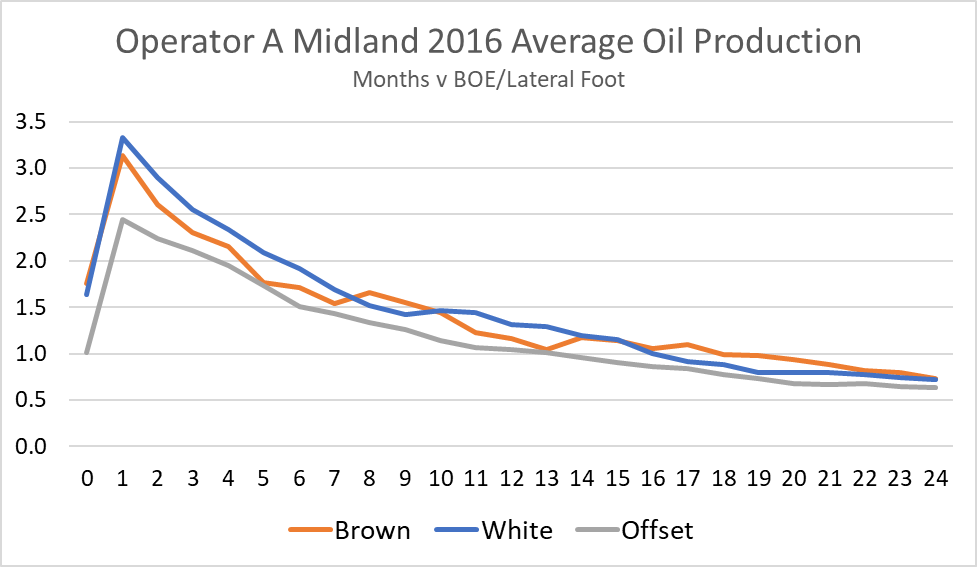
Operator B’s brown and white sand wells performed similarly in terms of barrels of oil produced per lateral foot, though brown sand fracs displayed slightly lower IP per lateral foot. However, both outperformed other Midland wells in the area. Rystad cannot conclude from this analysis alone that lower crush strength sands had no effect on decline rates, as the data do not have visibility over a variety of factors. Nevertheless, it does appear that Operator B has come to this conclusion itself, as the company appears to have continued to use brown sand in fracs and was one of a handful of companies that publically announced its usage of lower cost sand.
Operator C presents another interesting, counter-intuitive case study. Rystad positively identified that 37 of its wells in 2015 were fracked with white sand, 11 with brown sand and 37 with a mix of white and brown sand. Rystad compared these wells to 173 wells fracked by other operators near Operator C’s acreage.
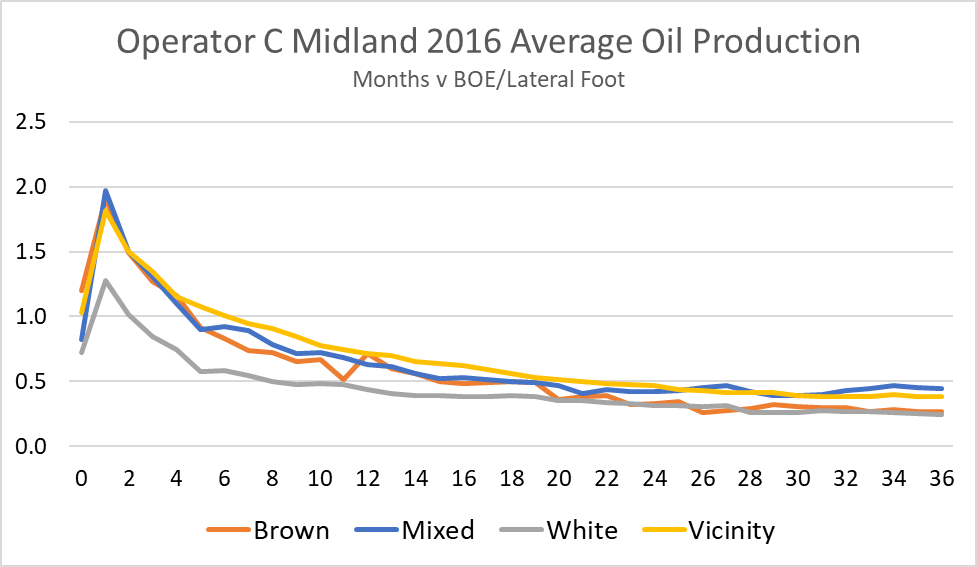
Operator C’s 2015 production profiles revealed that its white sand wells significantly underperformed its brown sand wells, its mixed sand wells and offset wells completed by other operators. One major reason is the lower proppant loading, averaging 20% fewer pounds of proppant per foot than its brown and mixed sand wells. This may demonstrate why operators choose lower cost proppant, which means operators can use more proppant for less money, usually leading to higher production.
Delaware Basin results
Intuitively, it might be expected that brown sands have a greater effect in the Delaware Basin, as treatment pressures are higher than in the Midland Basin.
In 2014 and 2015, Rystad saw higher IP but faster decline for brown sand wells.
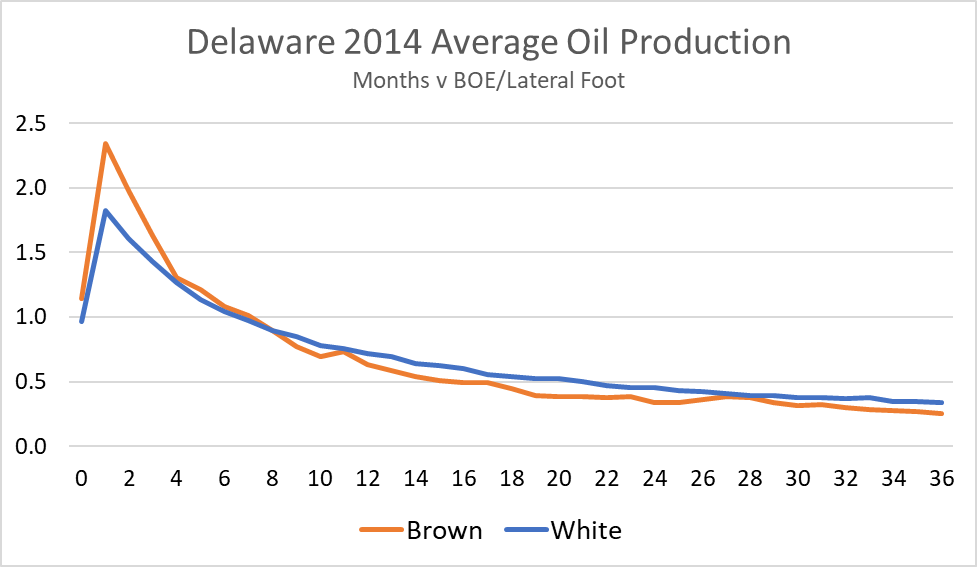
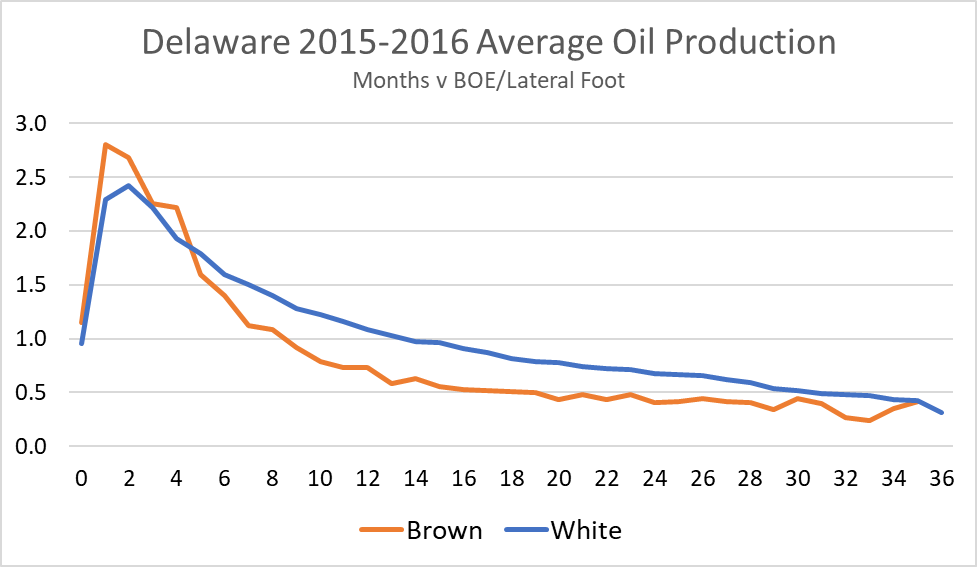
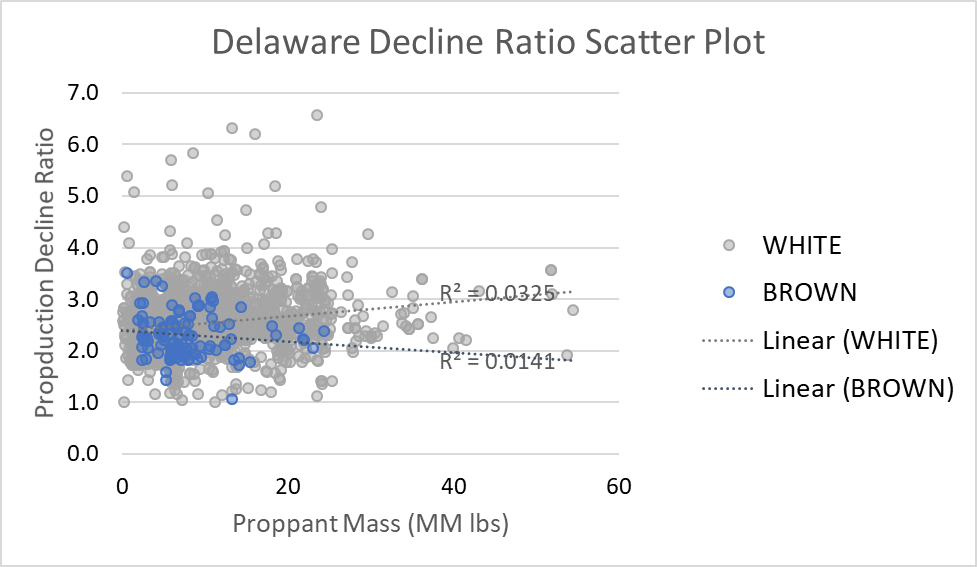
Figure 7, a scatterplot of all wells in the Delaware Basin, shows a slightly positive correlation between proppant mass and decline ratio. In this case, a higher decline ratio means slower production decline. This positive relationship does not appear to exist for brown sand wells. As in the Midland Basin, more insight can be gained by examining operators that used both brown and white sand in the Delaware Basin.
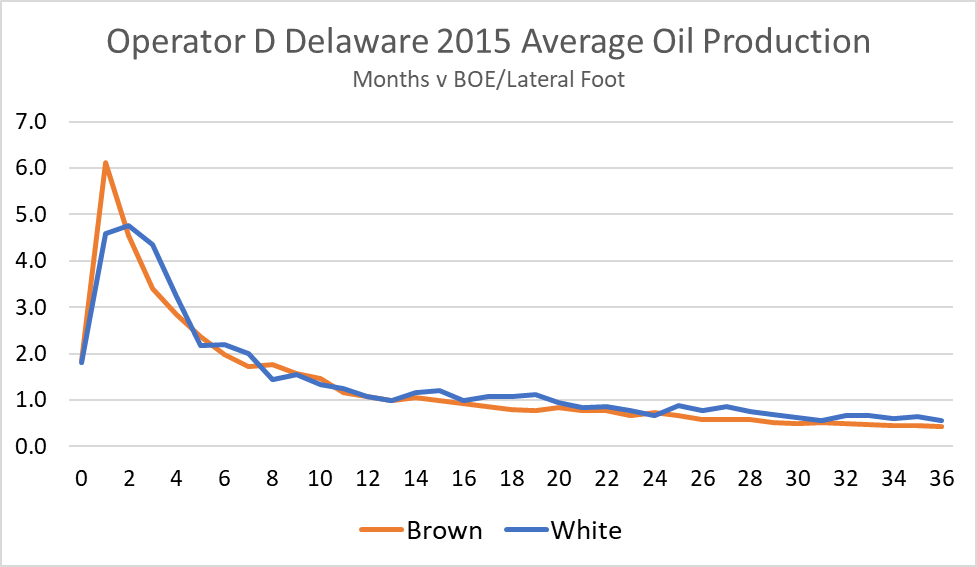
Rystad positively identified Operator D as having 25 fracs using brown sand and 16 using white sand in 2015. Operator D also exhibited similar production profiles for white and brown wells. Rystad could not compare these against wells fracked by other operators in the vicinity, as Operator D has a large acreage position.
Conclusions
Rystad found little evidence that the usage of lower crush strength proppants appreciably changes production decline curves in the Midland Basin, and the behavior of operators that have used both Northern white sand and Texas brown sand within the same area suggests that these operators have come to the same conclusion.
In the Delaware Basin, Rystad found evidence that, in aggregate, brown sand increases the decline rate. However, Rystad did not see this pattern when examining individual operators. Instead, Rystad saw that for one operator, brown sand wells performed very similarly to white sand wells. For another operator, Rystad again saw lower IP but not a faster decline.
An expanded statistical study of the aggregate effect of sand type in the Delaware Basin would be informative, controlling for downspacing, depth, treatment pressure, frac fluid type and other variables. An economic analysis, contextualizing the difference in performance between white sand and brown sand and taking into account the difference in costs in the form of a net present value or internal rate of return analysis would be important next steps in understanding the effect of sand type in the Delaware Basin.
(All charts are courtesy of Rystad Energy)
Read E&P's other January cover stories:
Recommended Reading

E&P Highlights: March 4, 2024
2024-03-04 - Here’s a roundup of the latest E&P headlines, including a reserves update and new contract awards.
E&P Highlights: March 11, 2024
2024-03-11 - Here’s a roundup of the latest E&P headlines, including a new bid round offshore Bangladesh and new contract awards.

Subsea7 Awarded Sizable Contract in GoM
2024-04-12 - Subsea7 will install a flowline for Talos’ Sunspear development in the Gulf of Mexico.

Seadrill Awarded $97.5 Million in Drillship Contracts
2024-01-30 - Seadrill will also resume management services for its West Auriga drillship earlier than anticipated.

CNOOC Makes 100 MMton Oilfield Discovery in Bohai Sea
2024-03-18 - CNOOC said the Qinhuangdao 27-3 oilfield has been tested to produce approximately 742 bbl/d of oil from a single well.