Learn more about Hart Energy Conferences
Get our latest conference schedules, updates and insights straight to your inbox.
Presented by:
![]()
Editor's note: This article appears in the new E&P newsletter. Subscribe to the E&P newsletter here.
Successful reservoir management often requires the identification of actionable field development opportunities. The outcome of this process helps the asset team meet production targets and improves recovery efficiency and reserves. Field development planning generally requires multidiscipline collaboration on top of a deep understanding of the target reservoir (geological complexity, production history, etc.). Therefore, the conventional approach has always been time-consuming and labor-intensive, as an abundance of manpower is needed for data gathering and analyzing as well as for vetting the results.
Today, an artificial intelligence (AI)-enabled cloud-native platform performs rapid and effective reservoir opportunity identification. This tool is built upon advanced AI/machine learning (ML) algorithms that are applied to multidisciplinary datasets. It streamlines multiple complex geological and engineering workflows, such as bypassed pay identification, drainage analysis, production forecast and others. Additionally, by intelligently integrating disparate data sources such as well logs, reservoir models, and production and completion data, it enables new cross-functional workflows. The final target is to generate a ranked catalog of actionable opportunities (recompletion, sweet spot, horizontal well) that enables an asset team to assess field development prospects collaboratively. Through innovative frameworks leveraging cloud computing, multi-scenario analysis becomes practical and leads to better risk management and shorter reservoir management decision cycles.
Robust methodology with streamlined geological and engineering workflows
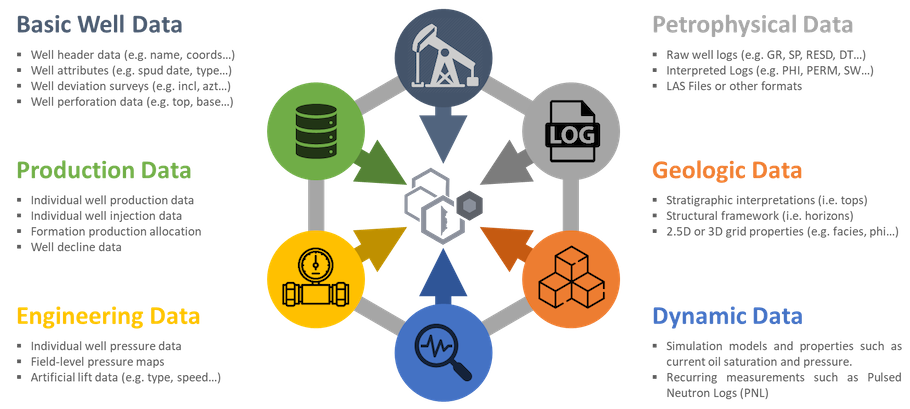
This technology intelligently automates many of the typically labor-intensive workflows in search of recompletion, sweet spot or horizontal well field opportunities. Before performing actual analysis, multi-disciplinary data are input with flexible standards and formats, including Energistics RESQML data format. Figure 1 illustrates the different data sources that can be integrated.
FIGURE 1. Integration of Multi-disciplinary Data
After data have been uploaded to the dataset manager, each data category is checked for data validity. Also, the platform cross-checks the multi-disciplinary data to examine the compatibility between different data sources. Following data validation, the opportunity identification workflow starts. It consists of several key components:
- Engineering analytics: It automatically performs contact analysis and flow unit allocation to allocate production per zone for each well, leveraging multiple data sources (e.g., production, completion, perforation, fluid properties and PLT/ILT information), and it performs decline curve analysis using AI-based event detection and type curve generation using unsupervised learning;
- Remaining pay identification: It identifies depth intervals with remaining pay potential using pay connectivity analysis, baffle detection algorithms, perforation strategy considerations and insights derived from dynamic data such as PNL logs and simulation models;
- Drainage analysis: It estimates the area that is likely drained/swept of oil for every producing well in each producing zone, and the methodology provides different analysis methods to tackle different reservoir types (e.g., geometric drainage analysis is suitable for matrix-dominated reservoirs while rate-based drainage analysis is better for fracture-dominated reservoirs);
- Geological risk assessment: It automatically assesses structural and mapping risks;
- Wellbore Accessibility: It evaluates the mechanical feasibility through AI-based deciphering and digitalization of wellbore diagrams;
- Production rate forecast: It estimates production gains by selecting from multiple options, such as statistical, analytical and ML-based methods;
- Spacing analysis: It identifies regions located within the acreage/volume allocated to existing wells to avoid interference with the new targets; and
- Target search: It identifies optimal locations for placing target wells (either vertical or horizontal) using automated optimization techniques, featuring relative probability of success modeling and comprehensive geo-engineering constraints.
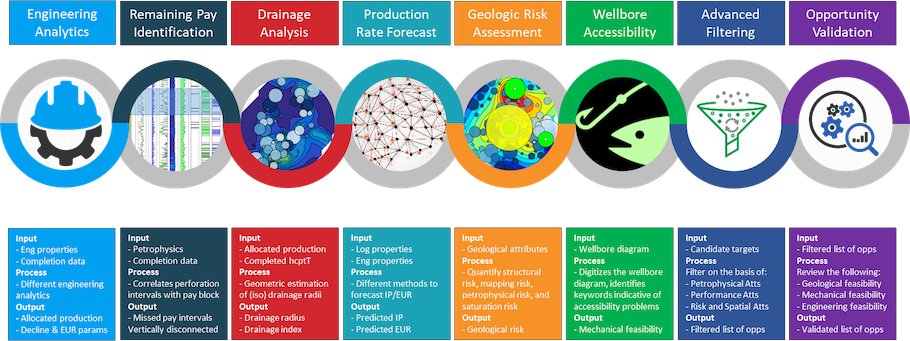
These individual components are assembled to build larger distinct workflows. The process automatically adjusts its analysis basis given the status of data availability, which varies case by case. Figure 2 summarizes the general automated workflow where necessary elements are systematically connected.
FIGURE 2. Summary of Recompletion Finder Workflow
After uploading the required multi-disciplinary data for a field, it usually takes only a few minutes to generate a catalog of field development candidates for each case being run. By analyzing historical field performance and benchmarking against analog assets, the system picks the appropriate and optimal settings for the given field. These settings can be adjusted, and it is easy to create and manage scenarios to investigate alternative assumptions and uncertainty in key parameters. Examples of settings include methods and parameters for mapping geo-engineering properties, well spacing ranges, net pay cut-offs and probability of success.
Cloud-native platforms promote enhanced user experience and collaboration
As a cloud-native solution, the system provides a secured collaborative cloud experience and leverages the full scalability of cloud computing. Users create a workspace and instantly invite others as collaborators.
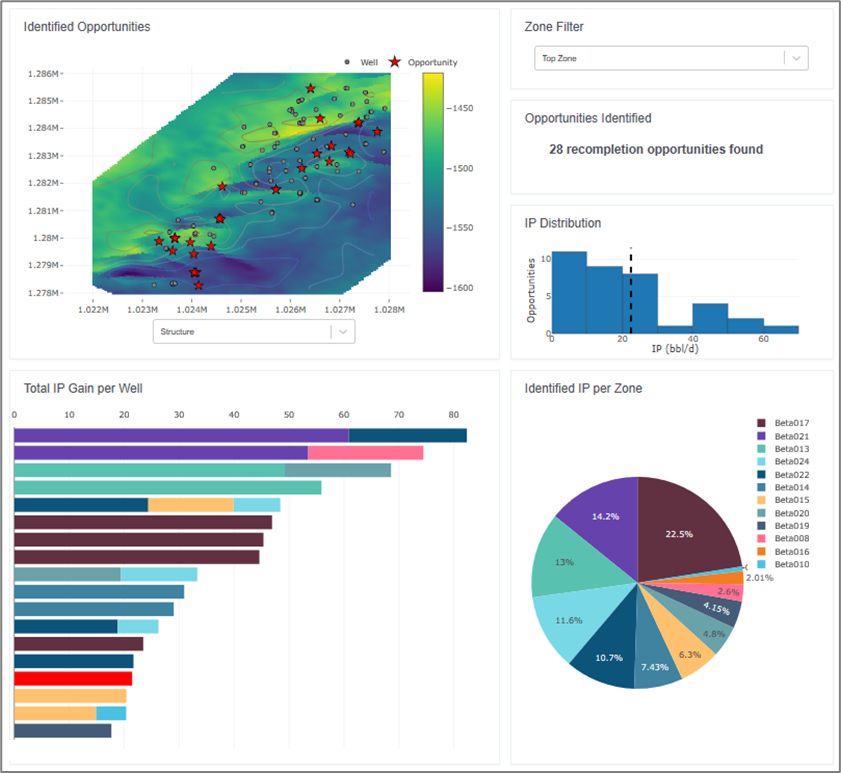
Flexible settings encourage users to test multiple hypotheses and share cases with other team members. Each case is executed, typically in a matter of minutes, and the results are accessible through a set of interactive browser-based dashboards, ready for the asset team’s review and vetting. Multiple views integrating multi-disciplinary data and analysis are presented (e.g., executive summary, historical well cards, and individual candidate cards summarizing the critical information related to each prospect, petrophysical characterization, geo-model assessment, production forecast and mechanical feasibility) to accelerate the vetting process and promote collaboration between asset team members.
Figure 3 presents an example dashboard highlighting selected opportunity location map, distribution by production zone and ranking of opportunities based on anticipated incremental production gain.
FIGURE 3. Example Dashboard
ML for intelligent production forecast
Specific AI components are embedded within different aspects of each workflow, such as a data-driven pay tracking algorithm, unsupervised learning-based type curving, stochastic optimization for interference analysis, and natural language processing for wellbore accessibility. Options exist for forecasting incremental production gain for each opportunity using first-principle methods or spatial-temporal interpolation from neighboring analog wells. Using ML to predict production is especially useful in the context of unconventional reservoirs.
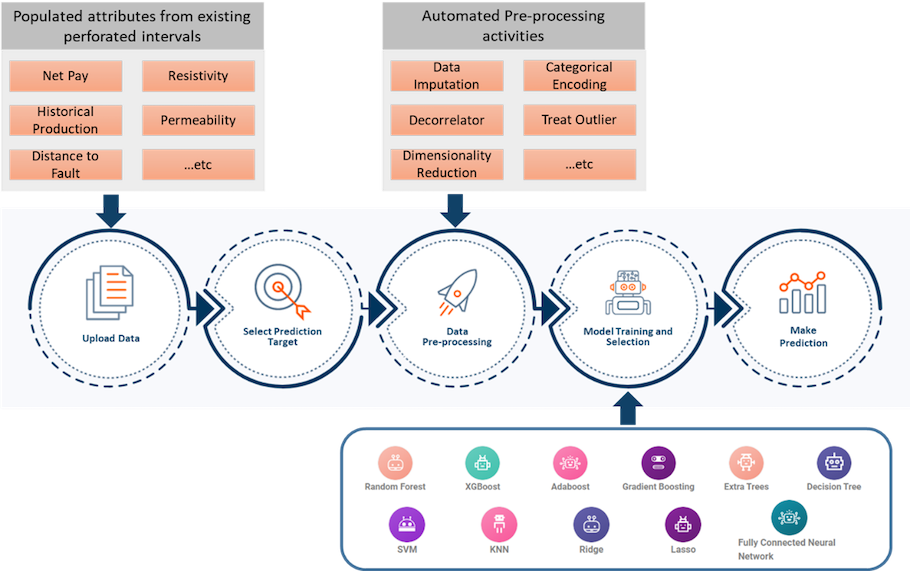
As the automated workflow has already gathered all geo-engineering and log/model-based attributes from existing perforated intervals along with their associated historical production data, the organized dataset serves as training data for future production prediction, given a new proposed completion interval or well trajectory.
In this workflow, multiple ML algorithms such as Random Forest, Artificial Neural Networks and Decision Tree can be evaluated simultaneously to select the best performing model(s).
Figure 4 illustrates the process of one ML-assisted production forecast.
FIGURE 4. Example of ML-Assisted Production Forecast
In addition to the ML-assisted methodology, other data-driven statistical methods exist, such as spatial-temporal interpolation based upon neighborhood analog wells’ data. Conventional physics-based methods are also included, such as Joshi and Furui methods for horizontal wells’ production forecast. A comparison of the forecasted production values from different methods should be carried out during the vetting phase for more realistic field development planning.
Case studies
The AI-powered opportunity identification framework has been successfully applied to a diverse portfolio of more than 100 oil and gas fields globally (including onshore and offshore, carbonate and sandstone, primary production and waterflood).
In almost every case, it led to an increase in production, reserves and/or capital efficiency while enabling more robust decision-making, increasing organizational agility and greatly improving efficiency.
Two case studies are highlighted in the table below, showing a magnitude of efficiency gained in terms of time, person months spent as well as the number of scenarios explored compared to the existing workflows.
|
|
|
|
||
|
|
|
|||
|
|
|
|
|
|
|
|
|
|
|
|
|
|
|
|
|
|
|
|
|
|
|
|
Conclusion
Digital transformation is not a new term in the oil and gas industry. However, with the current global changes in the industry and the need to be extremely efficient, increase productivity and reduce costs, embracing new technologies is essential for operators.
Today’s AI-based cloud-enabled technology is designed to help oil and gas operators implement a practical digitalization strategy in the areas of reservoir management and field development planning.
Recommended Reading

Kimmeridge Withdraws SilverBow Deal to Focus on E&P’s ‘Broken’ Board
2024-04-16 - Investment firm Kimmeridge said it had withdrawn its offer to combine its Eagle Ford E&P with SilverBow Resources as it promotes a slate of independent directors for SilverBow’s board at the company’s May annual meeting.

The JF Petroleum Group Acquires General Contractor GE Goodson Service
2024-04-15 - Following the transaction, GE Goodson will operate as The JF Petroleum Group’s Midland branch on a go-forward basis.
EQT, Equinor Agree to Massive Appalachia Acreage Swap
2024-04-15 - Equinor will part with its operated assets in the Marcellus and Utica Shale and pay $500 million to EQT in exchange for 40% of EQT’s non-operated assets in the Northern Marcellus Shale.
Marketed: Foundation Energy 162 Well Package in Permian Basin
2024-04-12 - Foundation Energy Fund V-A has retained EnergyNet for the sale of a 162 Permian Basin opportunity well package in Eddy and Lea counties, New Mexico and Howard County, Texas.

Stonepeak, Dominion Energy to Partner on Virginia Offshore Wind Project
2024-02-22 - Stonepeak will acquire a 50% interest in Dominion Energy’s offshore wind project, which is expected to be the largest offshore wind farm in the U.S.