Learn more about Hart Energy Conferences
Get our latest conference schedules, updates and insights straight to your inbox.
Considering the important role that perforation laboratory testing can play in establishing field completion strategies, and thus ultimately well performance, efforts are underway to further strengthen the link between laboratory results and field well performance predictions. Some of these efforts focus on integrating advanced diagnostic and computational tools (namely computed tomography [CT], and pore-scale flow simulation) into the perforation testing workflow. This integration enables local variations in permeability and porosity to be identified and quantified, thus improving the interpretation of perforation laboratory results, and ultimately the translation of these results to the downhole environment.
CT techniques have been used for core analysis, characterization and flow visualization since the early 1980s. This application has increased dramatically since 2012, following the installation of a CT scanning system on site at a perforating laboratory facility. As a result, this nondestructive technique has become a preferred method. Coinciding with this development has been the advancement and application of micro-CT technology to better understand pore-scale phenomena, both near and away from the perforation.
Halliburton conducted two experiments in which stressed rock targets were perforated under significantly different conditions. The first experiment involved perforating a moderate strength sandstone core under conditions that retained substantially all perforation damage, thus preserving the “crushed zone.” Micro-CT analysis of different locations within the crushed zone region revealed significant compaction, with porosity reductions ranging from 10% to 50% below that of the native rock. Permeability at one of these selected locations was determined and found to be reduced by about 35% below the native rock value. The second experiment involved perforating a very high-strength sandstone core under conditions intended to produce full cleanup.
The strong link between perforation performance and reservoir performance is well established. The importance of laboratory testing in optimizing field perforating strategies also has been demonstrated by multiple researchers. Recent advances in laboratory techniques (namely integration with advanced diagnostic and computational tools) are rendering perforating laboratory results even more valuable to asset owners. The ability to conduct tests and interpret and apply the results to downhole is becoming an increasingly important element of well development processes.
To this end, an effort is underway to integrate perforation laboratory testing, CT and pore-scale flow modeling. The goal of this effort is to enhance the interpretation of laboratory perforation and inflow test results and their application to the downhole environment. By quantifying and accounting for local variations in permeability and porosity, laboratory results can be more meaningfully linked to actual reservoir performance.
The judicious selection of plug location(s) along the perforation enables the determination of permeability variations near (versus far away from) the tunnel wall and along the tunnel length. This determination becomes critically important when translating inflow results to downhole, where the total inflow into the tunnel is matched in importance by the inflow distribution along the tunnel length. For example, in the downhole environment, an increment of inflow is more valuable at the tunnel tip than at the base as a result of near-wellbore effects, such as radial convergence and formation damage; in the laboratory, however, they are generally indistinguishable as a result of the absence of these effects.
First perforation test
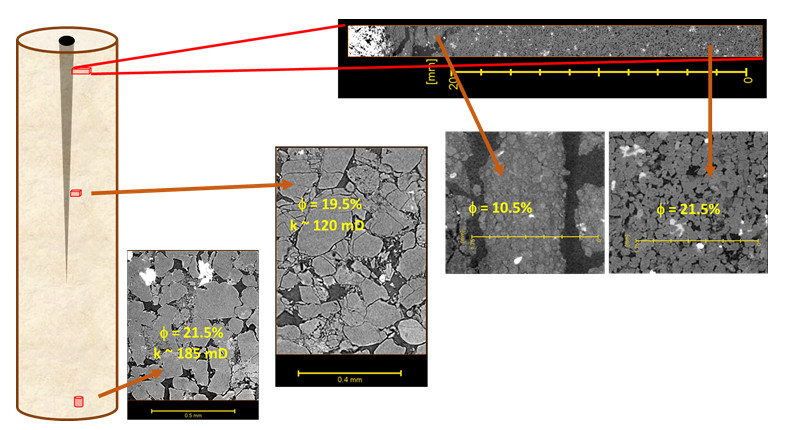
A Berea sandstone core was perforated by a 39-g HMX deep-penetrating (DP) charge, as would be typically fired from a 45⁄8-in. or 7-in. gun. Core saturation and wellbore fluids were both odorless mineral spirits, a light hydrocarbon commonly used in laboratory studies.
Quantitative volumetric analysis of the micro-CT samples reveals interesting features:
• The virgin rock porosity in this subregion is determined to be about 21.5%. This value is consistent with the known porosity range typical of Berea sandstone and is virtually identical to the 21% value measured for the full 7-in.-by-24-in. core before testing; and
• The crushed zone porosity in the selected subregion was determined to be 10.5%, about half the virgin rock porosity.
The porosity values previously described are the porosities detectable at this resolution. It is possible that further refinement of the scanning resolution would increase the detectable porosity. For the virgin rock, the near-exact match with measured porosity suggests this resolution level is adequate; however, for the crushed zone, if microporosity is present, then further refinement would be necessary to detect it. Figure 1 shows a montage of CT and micro-CT scan images and derived rock properties.
Second perforation test
A Crab Orchard sandstone core was perforated by a 26-g HMX DP charge. Core saturation and wellbore fluids were both odorless mineral spirits. This test featured a large initial static underbalance of 8,500 psi. Immediately following the shot, the wellbore pressure decreased by an additional 5,000 psi before recovering, exposing the tunnel to a total dynamic underbalance of approximately 13,500 psi. This condition would be expected to substantially clean the perforation and flush the tunnel (although relatively little laboratory cleanup data exist for such strong rocks at uniaxial compressive strengths greater than 20,000 psi).
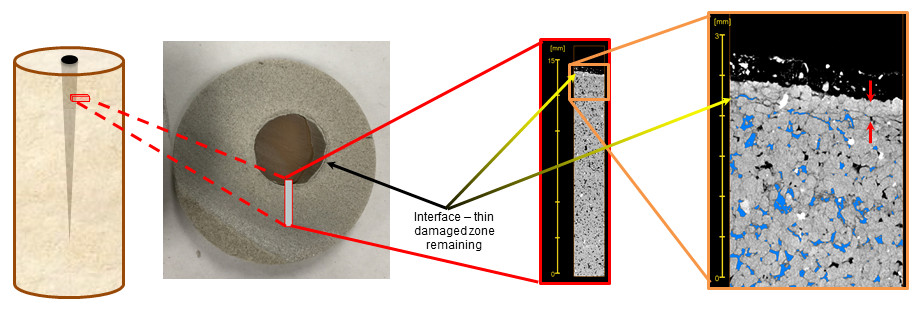
The whole-core scan of the Test 2 sample confirms that the tunnel is substantially empty with only trace amounts of liner material embedded in the rock near the tip region. The perforation was next overcored to a 2¼-in. diameter sample, which was rescanned with optimized settings. Comparing images of the tunnel obtained from the 7-in. and 2¼-in. samples, the optimized scan settings with the smaller sample reduce noise and begin to reveal finer details near the tunnel wall, particularly, a thin altered zone near the entrance and fine fractures near the tip.
A disk was cut from the 2¼-in. sample and rescanned at increased resolution (37 μ). It clearly reveals a thin zone (approximately 0.5 mm to 1 mm thick) near the tunnel wall. This zone appears to be a final increment of the perforation damaged region that was not completely removed (although it was separated by a small fracture).
An approximately 4-mm plug was next cut from the side of the perforation tunnel and analyzed by a micro-CT scan. Figure 2 shows the resulting 3.4-μ resolution images, which reveal the pore structure in the crushed zone and adjacent virgin rock. In the far right image, the connected porosity has been shaded blue. The absence of connectivity in the top layer confirms the compacted/permeability impaired nature of this thin remaining crushed zone.
Findings and future work
Ongoing work aims to expand these findings and capabilities. A main effort going forward centers on simulating core-scale perforation inflow, incorporating the localized rock property variations determined as described in this article. Additional property variations away from the perforation (e.g., natural heterogeneity and/or anisotropy that often exist in reservoir well core samples) also will be taken into account. Such localized variations, both near and away from the perforation, are generally not taken into account in typical American Petroleum Institute Recommended Practice 19B Section 4 test programs. Consequently, this ongoing effort will ultimately strengthen the relevance of Section 4 results to the downhole environment.
Recommended Reading
NAPE: Chevron’s Chris Powers Talks Traditional Oil, Gas Role in CCUS
2024-02-12 - Policy, innovation and partnership are among the areas needed to help grow the emerging CCUS sector, a Chevron executive said.
US Drillers Add Oil, Gas Rigs for Second Week in a Row
2024-01-26 - The oil and gas rig count, an early indicator of future output, rose by one to 621 in the week to Jan. 26.

Second Light Oil Discovery in Mopane-1X Well
2024-01-26 - Galp Energia's Avo-2 target in the Mopane-1X well offshore Namibia delivers second significant column of light oil.

CNOOC Sets Increased 2024-2026 Production Targets
2024-01-25 - CNOOC Ltd. plans on $17.5B capex in 2024, with 63% of that dedicated to project development.

E&P Highlights: Jan. 29, 2024
2024-01-29 - Here’s a roundup of the latest E&P headlines, including activity at the Ichthys Field offshore Australia and new contract awards.