Presented by:
![]()
Editor's note: This article appears in the E&P newsletter. Subscribe here.
Over the last few years, there has been an increase in the application of machine learning, a type of artificial intelligence, in the interpretation of seismic data.
The two primary machine learning applications include supervised and unsupervised learning approaches. Supervised learning takes a known set of descriptors or labels to known responses and trains a model, which is applied to new data to get reasonable results. In unsupervised learning, there is no prior knowledge of the data, and training adapts to the data identifying natural patterns and clusters.
This article specifically addresses the application of machine learning to seismic fault delineation.
Interpreting faults on seismic data
A key process necessary in interpreting seismic data is defining the presence of faults and their areal distribution and network. Faults are displacements in the sediment or rock column where the opposite walls have moved past each other. Faults are essential in understanding the geologic structure, reservoir seal integrity, field compartmentalization, migration flow paths and potential drilling hazards. Faults are usually recognized on seismic data as reflection discontinuities. Traditionally, faults on 3D seismic data have been manually picked by interpreters based on their experience and knowledge of the local geology. This is typically an extremely time-consuming process and highly subjective.
Beginning in the mid-1990s, seismic attributes that reveal seismic reflection continuities and discontinuities evolved with names such as semblance, coherency, curvature and variance. These seismic attributes helped better define faults in the seismic data but were subject to stratigraphic variations and noise, and they still required manual picking by interpreters.
CNN to delineate faults
As computer power increased over the last two decades, machine learning has become a viable approach to interpret faults on 3D seismic data.
A supervised deep learning approach called convolutional neural networks (CNN) has evolved to provide excellent results in delineating faults. Since CNN is a supervised learning process, labels or examples of picked faults must be input to build the machine learning model. If interpreters are picking the fault labels for training, the issues of time and interpreter bias come into play again. In addition, it is difficult to know how many faults must be picked by the interpreter sufficient to produce a viable machine learning model.
There is a growing body of evidence (Wu et al., 2019; Qie et al., 2020) that an alternative method to generate training data can produce better and faster results. This involves the generation of training data with fully faulted 3D synthetic seismic amplitude volumes. Because the training data is synthetic, the exact fault solution is input into the machine learning model, eliminating interpreter subjectivity and producing a more accurate result. Since the synthetic model is 3D, there are no issues related to labeling faults on certain inlines or crosslines. The machine learning model is already established and built, so the application delineates faults quite quickly. The addition of pre- and post-conditioning of the data produces an enhanced CNN fault detection result.
Figure 1 displays the machine learning workflow described for delineating faults using a U-net convolutional neural network architecture employing 3D synthetic seismic data.
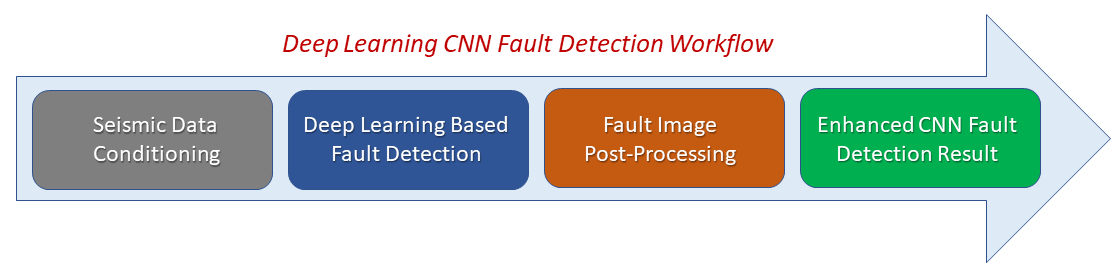
Figure 2a displays a 3D seismic amplitude line where the faults have been predicted by a U-Net CNN architecture. Figure 2b displays the same line and associated faults in a RGB display, where the three colors depict different limited frequency bands in the data. Figure 2 shows clear fault delineations on amplitude and RGB data. However, there are still interpretation limitations when faults extend deep in the sediment column and stratigraphic variations are complicated and inconsistent.
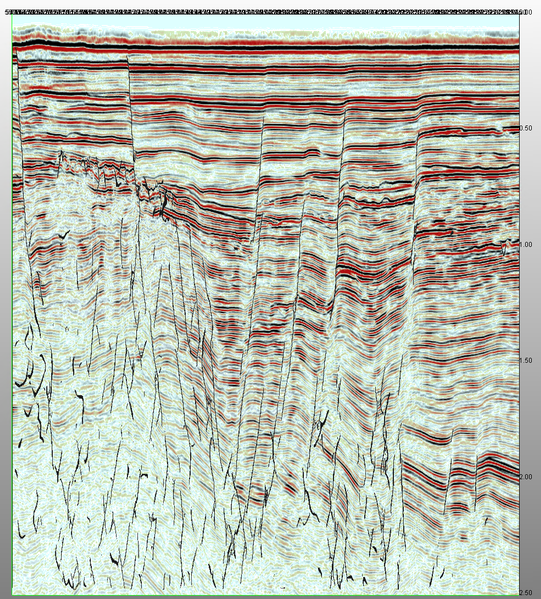
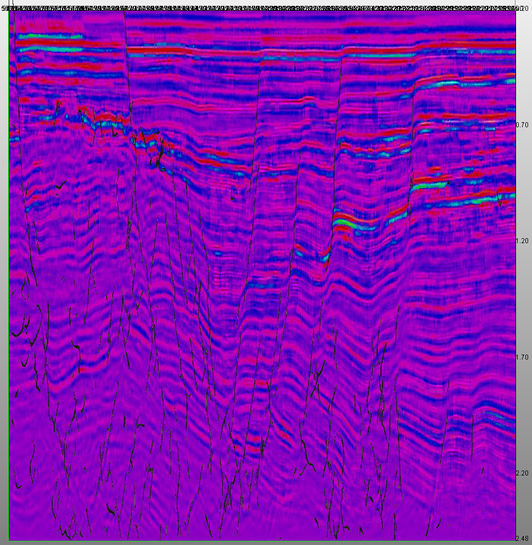
Figure 2a (top) depicts the seismic amplitude line from offshore New Zealand displayed in Paradise software with the CNN fault detection probability displayed. Figure 2b (bottom) depicts the same line displayed in RGB format with associated CNN detected faults. The three spectral decomposition bands employed for the RGB display contain central frequencies of 15, 35 and 65 Hz. (Data courtesy of New Zealand Petroleum and Minerals (NZPM); Figures courtesy of Geophysical Insights)
Combining supervised and unsupervised machine learning
To improve the interpretation of the 3D CNN fault results, an unsupervised machine learning neural network methodology called self-organizing maps (SOM) is employed. SOM efficiently combines multiple seismic attributes to determine natural patterns and clusters in the data. These patterns or clusters can identify variations in the subsurface geology and stratigraphy (Roy et al., 2013; Zhao et al., 2015). These patterns are identified by neurons in a 2D color map. Therefore, combining in a SOM analysis the appropriate set of seismic attributes to define stratigraphy and the CNN fault probability volumes produces results where high-resolution stratigraphy and facies can be correlated with the fault lineaments.
SOM has proven to be quite successful in defining detailed stratigraphy and facies at higher resolution than conventional seismic amplitude data (Roden et al., 2017), so this process enables the isolation of faults in specific fault blocks and in some cases the interpretation of fault cuts in wellbores.
Figure 3a displays a 3D seismic line with extensive faulting from complex polygonal faulting relatively shallow, a middle section with larger and different trending offsets, and a deeper section where the fault trends are difficult to correlate on the amplitude data alone. Figure 3b displays the same line from the SOM analysis where eight instantaneous attributes used to define stratigraphy are run with the results from the CNN fault probability volume.
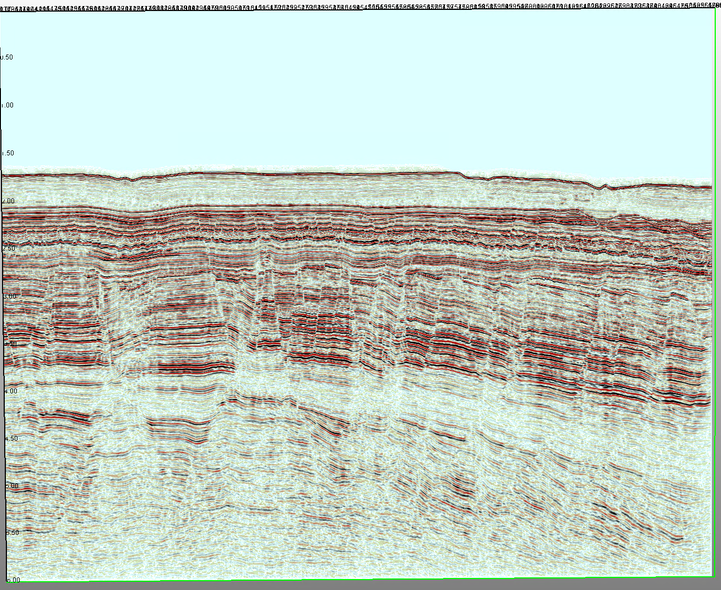
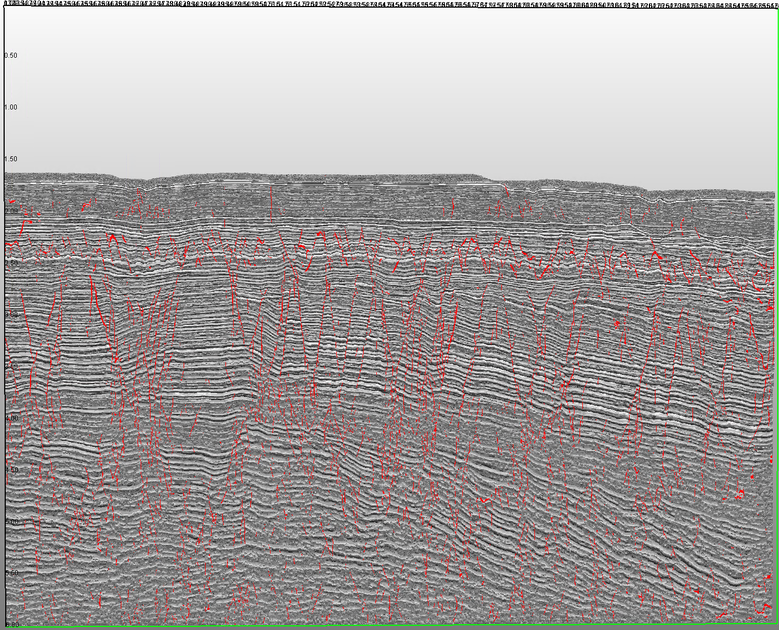
Figure 3a (top) shows a Paradise software display of a seismic amplitude line from offshore New Zealand denoting various complicated fault trends. Figure 3b (bottom) shows the same line with SOM results that have combined eight instantaneous attributes to define stratigraphy with one CNN fault detection result. (Data courtesy of New Zealand Petroleum and Minerals (NZPM); Figures courtesy of Geophysical Insights)
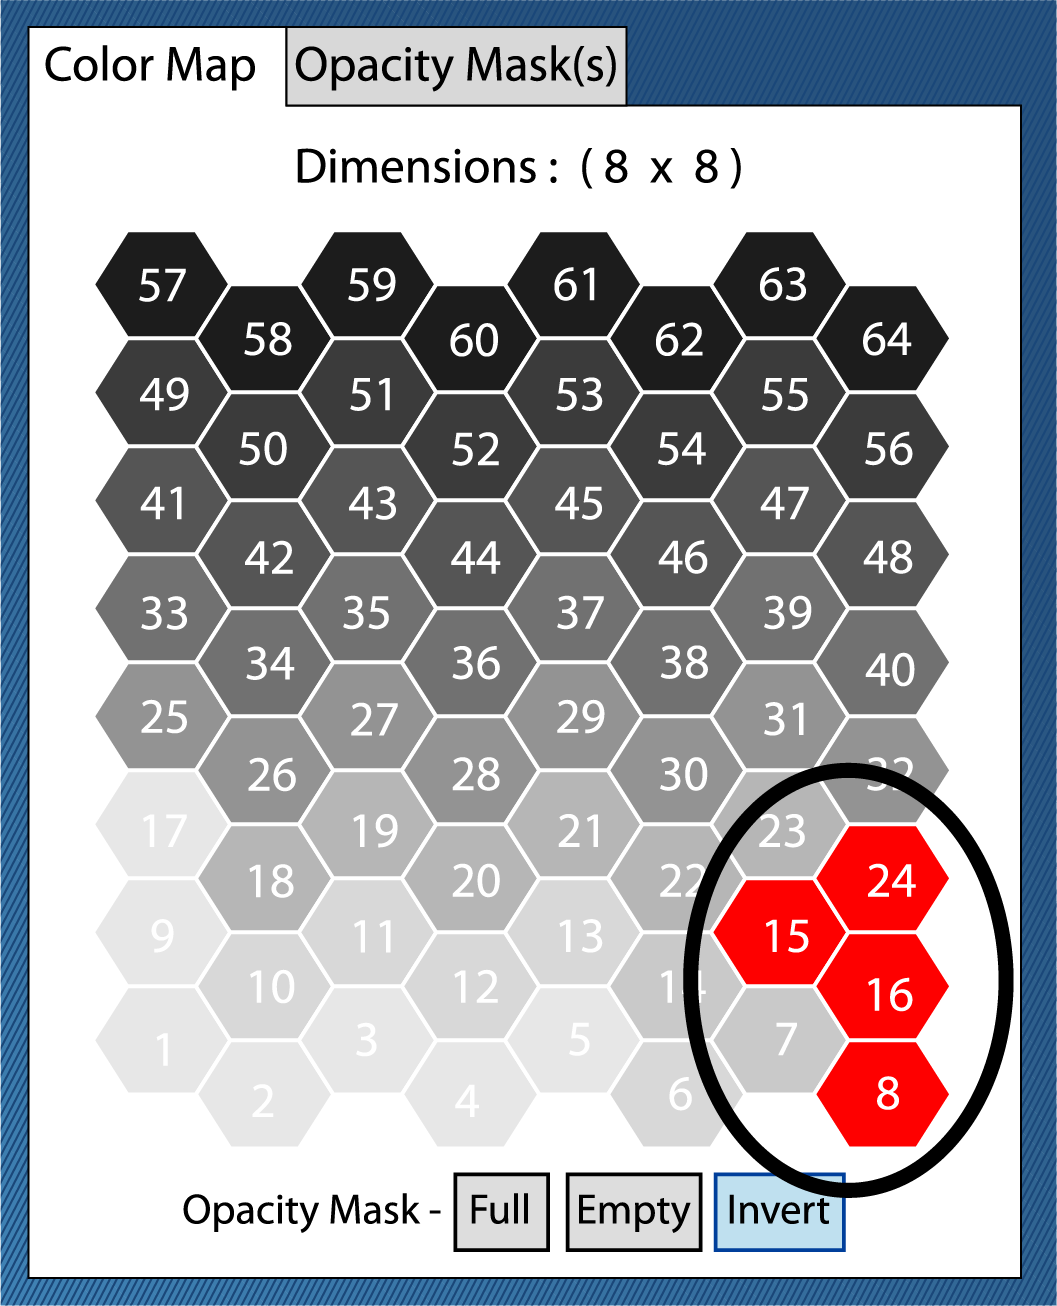
The 2D color map (Figure 4) displays 64 neurons, where each neuron represents a different pattern in the data. The faults identified by the CNN fault probability volume are associated with the four neurons in the bottom right and circled on the 2D color map.
It is evident in comparing these displays that not only is the stratigraphy more clearly defined, especially in the deeper parts of the section, but the fault correlations tied to the stratigraphy enables geoscientists to make a more accurate interpretation.
RELATED CONTENT:
Aug. 3, 2021 Unlocking the Potential of Mature Areas with Quantitative Seismic Analysis
July 26, 2021 AI and Ultralong Offsets Updating the Story of Utsira OBN
July 23, 2021 Visualization Platforms Create a New Look for Field Services Project Management
July 20, 2021 Reading Between the Lines of Subsurface Data
July 13, 2021 Exploration: Leveraging Digitalization to Maximize Results in the Field
June 22, 2021 Geomechanical Rock Properties Prediction from Seismic Data
June 14, 2021 Artificial Intelligence Platform Accelerates Reservoir Opportunity Identification
June 7, 2021 Rock Physics Diagnostics: A Prerequisite for Successful Modeling
Recommended Reading
Air Products Sees $15B Hydrogen, Energy Transition Project Backlog
2024-02-07 - Pennsylvania-headquartered Air Products has eight hydrogen projects underway and is targeting an IRR of more than 10%.

Air Liquide Eyes More Investments as Backlog Grows to $4.8B
2024-02-22 - Air Liquide reported a net profit of €3.08 billion ($US3.33 billion) for 2023, up more than 11% compared to 2022.

Kimmeridge Fast Forwards on SilverBow with Takeover Bid
2024-03-13 - Investment firm Kimmeridge Energy Management, which first asked for additional SilverBow Resources board seats, has followed up with a buyout offer. A deal would make a nearly 1 Bcfe/d Eagle Ford pureplay.
M4E Lithium Closes Funding for Brazilian Lithium Exploration
2024-03-15 - M4E’s financing package includes an equity investment, a royalty purchase and an option for a strategic offtake agreement.
Laredo Oil Subsidiary, Erehwon Enter Into Drilling Agreement with Texakoma
2024-03-14 - The agreement with Lustre Oil and Erehwon Oil & Gas would allow Texakoma to participate in the development of 7,375 net acres of mineral rights in Valley County, Montana.